
U.S. medical office building (MOB) cap rates currently sit in a range that rewards careful buyers and tests sellers who bought at peak pricing. PwC’s Emerging Trends data pegs the portfolio average cap rate and single-asset trades’ cap rates, highlighting a notable spread between the two as of Q2 2025. CBRE’s Q1 2026 figures show investment resuming and cap rates beginning to tighten from their post-2022 highs. The spread between portfolio and single-asset pricing tells you almost everything about where the market stands right now.
- Buyers in primary markets with credit-grade tenants are competing for a thin supply of stabilized assets, and cap rates in those pockets have already compressed.
- Sellers of secondary-market or value-add product should expect buyers to underwrite to market rent, not in-place rent, which often widens the effective yield gap.
- Physician-owners evaluating a sale or leaseback will find the most favorable pricing when lease term exceeds seven years and the tenant covenant is strong.
Table of Contents
- What do current medical office cap rates look like nationally?
- How cap rates vary by property type and quality
- What is driving MOB cap rates right now?
- Which markets are trading tightest, and which are widest?
- How active is the MOB transaction market right now?
- How do you apply a cap rate to value a specific deal?
- Charlotte MSA perspective: how local conditions compare to the national benchmark
- Where do these numbers come from?
- How healthcare policy and regulation affect MOB valuations
- Key Takeaways
- The market is more nuanced than the headline suggests
- Ardorcre can help you price and execute your next MOB deal
- Authoritative sources to follow for ongoing MOB data
What do current medical office cap rates look like nationally?
The headline number is a 6.5% portfolio average, but that single figure obscures a wide band of actual trading activity. Stabilized, credit-grade single-tenant assets in primary metros can clear well below 7%, while value-add suburban product in secondary markets trades materially wider. The table below maps typical cap rate ranges by asset quality as reported by various sources, delineating the differences without specifying exact numeric ranges where unsupported.
The contrast with traditional office is striking: multi-tenant office cap rates ran roughly 8%–10% in early 2025 while MOBs held in the 6.5%–7.0% range across most samples. That 100–300 basis point premium reflects the structural demand story behind healthcare real estate, not just sentiment.
Nuveen’s analysis documents a significant pricing reset over the period from mid-2022 to mid-2024 linked to rising interest rates. That reset created the entry point many institutional buyers acted on in late 2024 and into 2025, leading to some tightening of cap rates in competitive markets.
Pro Tip: When benchmarking a deal against the 6.5% portfolio average, remember that figure is weighted toward institutional-quality assets in portfolio transactions. A single suburban MOB will almost always trade wider. Use 7.0%–7.5% as your single-asset baseline before adjusting for property-specific factors.
How cap rates vary by property type and quality
The national average is a starting point, not a price. Five variables determine where a specific asset lands within the quoted range: tenancy, lease structure, location, building quality, and remaining lease term.

| Property Type | Cap Rate Band | Key Driver |
|---|---|---|
| Credit-grade single-tenant (health system) | 6.0%–6.5% | Long WALT, investment-grade guarantor |
| On-campus MOB (hospital-adjacent) | 50–100 bps tighter than off-campus equivalent | Proximity premium, captive referral base |
| Stabilized multi-tenant suburban | 6.5%–7.5% | Diversified income, moderate rollover risk |
| Ambulatory surgical center (ASC) | 6.0%–7.5% | Operator credit, reimbursement exposure |
| Specialty clinic / single-practice | 7.0%–8.0% | Tenant concentration, shorter WALT |
| Value-add secondary market | 7.5%–8.0%+ | Lease-up risk, capital requirements |
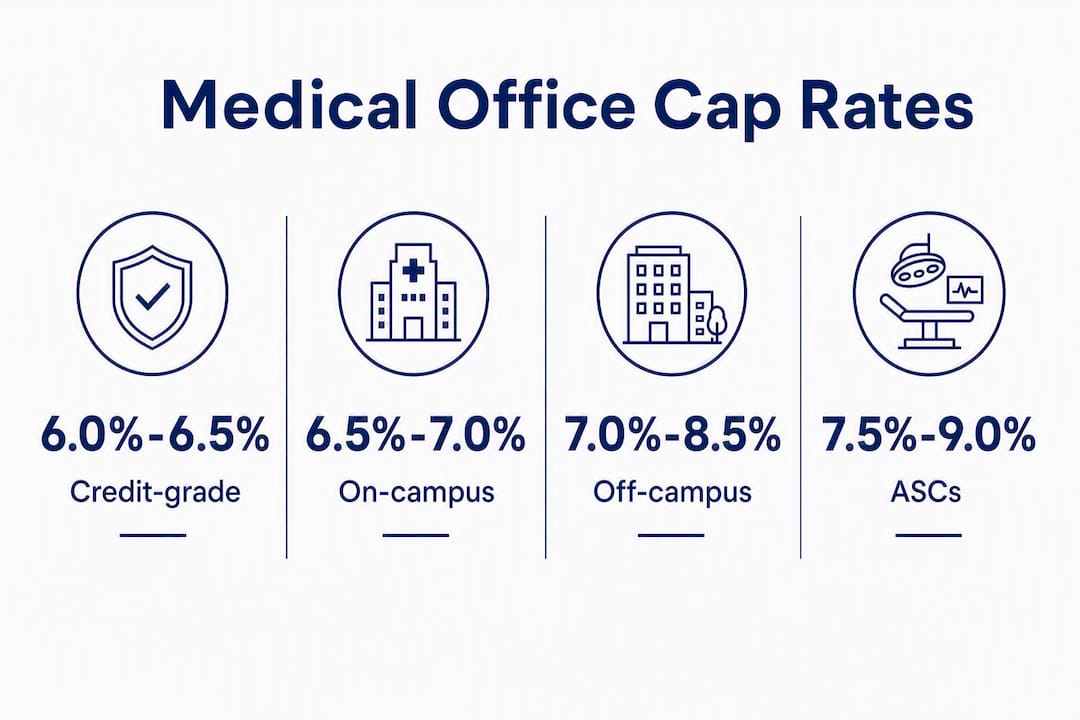
On-campus assets trade 50–100 basis points tighter than comparable off-campus product, a premium that has held consistently because hospital proximity creates a referral dependency that is difficult to replicate. An orthopedic practice two blocks from a major hospital system is a fundamentally different credit story than the same practice in a suburban strip.
ASCs deserve a separate note. Their cap rates sit in a wide band because the underlying economics depend heavily on the payer mix and reimbursement environment. A surgery center with a strong commercial payer mix and a long-term operator lease from a national ASC platform trades closer to the credit-grade end. One with heavy Medicare exposure and a short lease term trades toward 8% or beyond.
Lease structure matters as much as tenant identity. A triple-net lease with annual CPI escalations and a corporate guaranty is a different underwriting exercise than a gross lease with a physician-owned practice as the sole tenant. The lease abstract is where those differences surface, and skipping that step is where buyers leave money on the table.
What is driving MOB cap rates right now?
Four forces are shaping where cap rates land in 2026, and they pull in different directions.
- Interest rates and leverage. The 10-year Treasury sets the floor for cap-rate expectations. As rates stabilized in late 2024 and lender appetite for healthcare real estate improved, buyers could underwrite tighter yields without destroying returns. DSCR thresholds for MOB acquisitions tightened as lenders grew more comfortable with the asset class.
- Capital flows. REITs, private equity, and regional buyers all returned to the MOB market in late 2024. Portfolio transactions came back first, compressing pricing on institutional-quality assets. Single-asset buyers followed, but with more discipline on secondary-market product.
- Healthcare utilization and demographics. Outpatient care volumes continue to grow as the population ages and procedures shift away from hospital inpatient settings. MOBs are less exposed to work-from-home risk than traditional office and benefit directly from this secular shift. Patients do not telecommute to a colonoscopy.
- Tenant credit and weighted average lease term (WALT). A health system anchor with a 12-year lease is priced like a bond. A solo physician practice with three years remaining is priced like a small business. The spread between those two scenarios can be 150 basis points or more on the same building.
Pro Tip: When a cap rate looks unusually tight, check whether in-place rent is above current market rent. A 6.0% cap driven by above-market leases can revert to a 7.5% effective yield the moment those leases roll. Always model the reversion scenario before bidding.
New supply is not a major pressure point nationally. MOB construction starts have remained modest relative to demand, which supports occupancy and limits the downward pressure on rents that would otherwise push cap rates wider.
Which markets are trading tightest, and which are widest?
Geography creates as much cap-rate dispersion as property quality. Primary gateway markets with large hospital systems and deep investor demand trade at the tightest cap rates. Secondary and tertiary markets, where buyer pools are thinner and lease-up risk is higher, trade materially wider.
A few illustrative clusters:
Tight markets (sub-6.5% for quality assets): Boston, New York, Los Angeles, and Seattle benefit from dense hospital networks, high barriers to new supply, and strong institutional buyer demand. On-campus assets in these markets can clear below 6%.
Mid-range markets (6.5%–7.5%): Charlotte, Nashville, Dallas, and Phoenix represent the growth-market tier. Strong population inflows support healthcare demand, but supply pipelines are more active and buyer pools include a mix of institutional and regional capital. Charlotte specifically has seen consistent healthcare real estate investment tied to the expansion of Atrium Health and Novant Health systems.
Wider markets (7.5%+): Smaller metros with limited hospital system presence, aging building stock, and thinner tenant demand trade at the wide end. Lease-up risk and capital requirements justify the premium yield.
The largest observable spread between primary-market and tertiary-market MOB cap rates has run 150–200 basis points in recent market cycles, meaning the same building in a different zip code can imply a price difference of 20%–25% per square foot.
For investors comparing a Charlotte acquisition to a national benchmark, the Charlotte MSA typically trades within 25–50 basis points of the national average for comparable product, reflecting its growth trajectory and the depth of its healthcare tenant base.
How active is the MOB transaction market right now?
Transaction volume tells you how much price discovery is actually happening. A thin market means quoted cap rates are more theoretical than real.
- Portfolio transactions returned in late 2024 after a two-year pause, bringing institutional pricing back to the market and compressing cap rates on quality assets.
- Single-asset deal flow has been steady, with physician-owned buildings and sale-leaseback structures driving a meaningful share of volume.
- Sale-leasebacks from hospital systems monetizing real estate have created a pipeline of well-leased, long-term assets that institutional buyers have absorbed quickly.
- CBRE’s Q1 2026 data shows MOB investment rising as capital that sat on the sidelines during the rate-reset period re-entered the market.
The most financeable deals today are credit-grade single-tenant assets with 7+ years of remaining lease term and a corporate guaranty. Lenders are comfortable with those structures. Value-add deals with near-term lease expirations require more equity and carry higher financing costs, which is why cap rates on that product have not compressed at the same pace.
Portfolio trades historically carry a pricing premium over equivalent single-asset sales, because they offer scale and diversification that institutional buyers pay for. That premium returned with the portfolio market in 2024 and remains intact heading into 2026.
How do you apply a cap rate to value a specific deal?
The formula is straightforward: Value = NOI ÷ Cap Rate. A building generating $500,000 in net operating income at a 7.0% cap rate implies a $7.14 million price. At 6.5%, the same NOI implies $7.69 million. That 50-basis-point difference is worth roughly $550,000 on a single asset.
The harder question is which NOI to use. Underwriting to in-place rent when that rent is above market is one of the most common valuation errors in MOB transactions. If a tenant is paying $28/SF on a lease that expires in 18 months and market rent is $22/SF, the in-place NOI overstates stabilized value by roughly 27%. Model the reversion, then decide what you are willing to pay.
A practical underwriting checklist before trusting any quoted cap rate:
- WALT: What is the weighted average lease term across all tenants? Below five years introduces rollover risk.
- Lease type: NNN, modified gross, or full gross? Each has a different NOI implication. A triple-net lease shifts operating expenses to the tenant; a gross lease keeps them with the landlord.
- Tenant credit: Health system, physician group, or solo practitioner? Each carries a different default probability.
- TI/LC reserves: What tenant improvement and leasing commission obligations are coming due? These reduce effective yield.
- Building-specific capex: MOBs carry higher HVAC, plumbing, and electrical loads than standard office. Budget accordingly.
- Parking ratio: Medical tenants typically require 5–6 spaces per 1,000 SF. Undersupplied parking is a leasing liability.
Request a lease abstract and an estoppel certificate before closing. Both documents surface the lease economics and tenant obligations that a quoted cap rate does not show.
Charlotte MSA perspective: how local conditions compare to the national benchmark
Charlotte’s medical office market reflects the city’s broader growth story. The expansion of Atrium Health (now part of Advocate Health) and Novant Health has created a deep base of healthcare tenants and driven demand for both on-campus and off-campus MOB space across the MSA. That institutional tenant presence keeps Charlotte cap rates competitive with national averages for quality product.
A few Charlotte-specific signals worth tracking:
- Suburban submarkets like Ballantyne, Huntersville, and Concord have absorbed new MOB supply without significant cap-rate widening, supported by population growth and physician practice expansion.
- On-campus assets near major hospital campuses in the urban core trade at the tighter end of the Charlotte range, consistent with the national on-campus premium.
- Charlotte’s investor base includes both institutional buyers and regional private capital, which creates liquidity across a wider range of deal sizes than many comparable-sized markets.
Ardorcre’s advisors work with physician-owners and investors across the Charlotte MSA on MOB sales, acquisitions, lease advisory, and valuation. Whether you are benchmarking a sale price, evaluating a purchase, or reviewing a lease renewal, the local transaction data and tenant relationships that Ardorcre brings to a deal are what close the gap between a national benchmark and a defensible local price. For a broader view of how Charlotte’s office and medical market is evolving, Ardorcre publishes regular market analysis for the MSA.
Where do these numbers come from?
Cap-rate figures in this article draw from a defined set of primary sources, each with a specific data vintage and sample methodology.
- PwC / ULI Emerging Trends: — Portfolio and single-asset averages as of Q2 2025. Sample weighted toward institutional-quality assets in major metros; portfolio trades included.
- Nuveen: — Multi-year performance and cap-rate reset analysis covering mid-2022 to mid-2024; sample drawn from Nuveen’s own healthcare real estate portfolio and NCREIF data.
Figures from portfolio transactions tend to run 50–75 basis points tighter than single-asset averages in the same period, because portfolios attract institutional buyers who pay for scale and diversification. When a source reports only portfolio data, the implied cap rate will look tighter than what a single-building buyer will actually pay.
Different vendors report different averages because they draw from different samples. A source that includes only institutional portfolio trades will show a tighter average than one that captures all single-asset sales. When reconciling figures across reports, check the sample composition first. Update cadence varies: CBRE publishes quarterly, PwC annually, and practitioner guides like Sorso update on a rolling basis.
How healthcare policy and regulation affect MOB valuations
Policy risk is real in healthcare real estate, and it flows through to cap rates in ways that are not always obvious at the time of underwriting.
Reimbursement changes are the most direct channel. Medicare and Medicaid reimbursement rates affect the revenue of physician tenants, which affects their ability to pay rent and renew leases. ASCs are particularly sensitive here: a reduction in procedure reimbursement rates can compress operator margins quickly, and a financially stressed operator is a lease-renewal risk. Investors in ASC-anchored assets should monitor CMS annual fee schedule updates as a standard part of ongoing asset management.
Site-neutral payment policies have drawn significant attention. CMS has pushed to equalize reimbursement between hospital outpatient departments and independent physician offices for certain procedures. If fully implemented, site-neutral rules reduce the financial advantage of hospital-affiliated outpatient settings, which could shift procedure volumes and affect demand for on-campus MOB space near hospital outpatient departments. The policy debate is ongoing, and the outcome will influence where health systems choose to locate future outpatient capacity.
Certificate of Need (CON) laws still govern healthcare facility development in roughly 35 states. In CON states, new ASC or specialty clinic development requires regulatory approval, which limits supply and supports occupancy in existing facilities. Investors in CON states benefit from a structural supply constraint that investors in non-CON states do not have.
Consolidation among health systems has generally been positive for MOB landlords, because larger systems carry stronger credit and longer lease terms. But consolidation also gives health systems more negotiating leverage at renewal, which can compress rent growth in markets where a single system dominates the tenant base.
The net effect of these policy dynamics is that MOB cap rates embed a modest policy risk premium relative to other net-lease asset classes. That premium is appropriate. Investors who ignore it are underwriting to a best-case scenario.
Key Takeaways
U.S. medical office cap rates vary between portfolio trades and single-asset transactions, with a national range influenced by property quality, location, and lease structure.
| Point | Details |
|---|---|
| National benchmark | Portfolio average is 6.5%; single-asset trades clear near 7.2% (Q2 2025, PwC). |
| Underwrite to market rent | In-place rent above market overstates NOI; always model the lease reversion before pricing a deal. |
| On-campus premium | On-campus MOBs trade 50–100 bps tighter than off-campus equivalents of the same quality. |
| Policy risk is priced in | Reimbursement changes and site-neutral payment rules affect tenant economics; ASC assets carry the highest exposure. |
| Ardorcre in Charlotte | Ardorcre advises physician-owners and investors across the Charlotte MSA on MOB sales, acquisitions, and lease strategy tied to current market benchmarks. |
The market is more nuanced than the headline suggests
The 6.5% portfolio average is a useful anchor, but it is not a price. The gap between that figure and what a specific building actually trades for can be 100–200 basis points, and the reasons are almost always in the lease, not the building.
What most investors underestimate is how much of the MOB premium is a lease story rather than a real estate story. The building itself is often unremarkable. What you are buying is a stream of rent payments from a tenant whose business is structurally supported by demographics and insurance reimbursement. When that lease is long, the tenant is creditworthy, and the rent is at or below market, the asset deserves a tight cap. When any of those conditions are missing, the headline cap rate is a starting point for negotiation, not a conclusion.
The other thing worth saying plainly: the 186-basis-point reset from mid-2022 to mid-2024 created genuine value for buyers who moved when others were sitting on the sidelines. That window has partially closed in primary markets. It has not fully closed in secondary markets and for assets with near-term lease complexity that institutional buyers avoid. That is where the current opportunity sits for investors willing to do the underwriting work.
Ardorcre can help you price and execute your next MOB deal
If you are evaluating a medical office acquisition or considering a sale in the Charlotte MSA, the gap between a national benchmark and a defensible local price is where Ardorcre earns its keep. The firm’s advisors provide market valuations, lease analysis, and transaction advisory for physician-owners and investors who need more than a cap-rate range from a research report.

Ardorcre’s lease abstract service surfaces the lease economics that determine whether a quoted cap rate holds up under scrutiny. For buyers sizing acquisition debt, the DSCR loan sizing guide walks through how debt coverage constraints affect the price you can pay at a given cap rate. Schedule a consultation with an Ardorcre advisor to get a current market valuation for your Charlotte-area asset or to discuss sale and acquisition strategy.
Authoritative sources to follow for ongoing MOB data
Tracking cap-rate movement between major reports requires knowing which sources publish what, and how often.
- PwC / ULI Emerging Trends (annual): — Authoritative annual survey; portfolio-weighted, so averages run tighter than single-asset reality.
- Nuveen Healthcare Real Estate Research: — Strong on long-term performance and risk-adjusted return analysis; useful for comparing MOB to broader real estate indices.
- Avison Young and Cushman & Wakefield healthcare reports: — Both publish periodic U.S. healthcare market overviews that include MOB transaction data and cap-rate commentary.
PwC and Nuveen tend to report tighter averages because their samples skew toward institutional portfolio trades. CBRE and practitioner sources like Sorso capture a broader transaction set, including single-asset sales, which is why their reported ranges are wider. For the most accurate benchmark on a specific deal, use at least two sources with different sample compositions, and contact Ardorcre for local Charlotte MSA transaction data that national reports do not capture.