
Charlotte’s warehouse vacancy rate was 7.1% in the third quarter of 2026, down from 7.9% a year earlier, according to a Q3 broker report cited by Bisnow on November 10, 2026. The headline number is falling because leasing is outrunning new deliveries. The average hides a split, though. Newer big-box buildings and older second-generation space are behaving very differently, and which one you own or lease changes what the number means for you.
TL;DR
- Q3 2026 industrial vacancy in the Charlotte market was 7.1%, versus 7.9% a year earlier. Leasing activity in the report was 3.2 million square feet, up 55.6% year over year.
- The construction pipeline has shrunk, so new supply is no longer pushing vacancy up the way it did after the 2023 and 2024 deliveries.
- Vacancy is not even. Modern Class A product is absorbing space faster than older Class B and C buildings, and small-bay buildings are a separate story.
- Power availability is becoming a gating factor for new projects and for backfilling existing buildings.
- Owners, investors and tenants should read the vacancy rate for their own building type and submarket, not the metro average.
Table of Contents
- What the latest Charlotte warehouse vacancy rate says
- Why vacancy rose, then started to flatten
- Where the vacancy sits
- Power is the new constraint
- What the vacancy trend means for you
- How to read the next vacancy report
- Our perspective
- Get a building-level read on Charlotte industrial space
- FAQ
- Sources
What the latest Charlotte warehouse vacancy rate says
Vacancy rates move every quarter and every data provider counts a little differently, so treat any figure as a published number for its period. The Q3 2026 figure above is 7.1%. It is a report-based figure for the Charlotte metro, and it will be replaced by the next quarterly release.
The same report found leasing activity of 3.2 million square feet, up 55.6% from the same period in 2025. That is the engine behind the drop from 7.9% to 7.1%: more space was taken than the market could add.
A few plain definitions help when you read these reports:
- Vacancy rate is the share of total industrial square footage that is empty. The reports you will see quote it as a percentage of all inventory tracked in the market.
- Direct vacancy counts space the landlord is marketing, not space a tenant is trying to sublease. Some reports quote direct vacancy and others add sublease space, which is one reason two firms can publish different rates for the same quarter.
- Absorption is the net change in occupied space over a period. Positive absorption means more space was leased than vacated.
- Class A means the newest, highest-spec buildings, typically with taller clear heights and modern loading. Class B and C are older, second-generation buildings.
The practical rule: compare numbers from the same source over time. A 7.1% from one provider and a 10% from another are not a contradiction, they are different methods. For our own read of how to interpret the numbers, see Charlotte industrial vacancy: what the numbers mean.
Why vacancy rose, then started to flatten
Charlotte took in a large wave of new warehouse buildings. As the market digested them, vacancy climbed. The direction changed as construction slowed.
REBusinessOnline reported on August 3, 2026 that Charlotte’s development pipeline contracted to about 4.8 million square feet in the first quarter of 2026. That compares with a prior ten-quarter average of 8.7 million. Leasing in that quarter was about 2.2 million square feet. Vacancy appears to be flattening as leasing outpaces new deliveries.
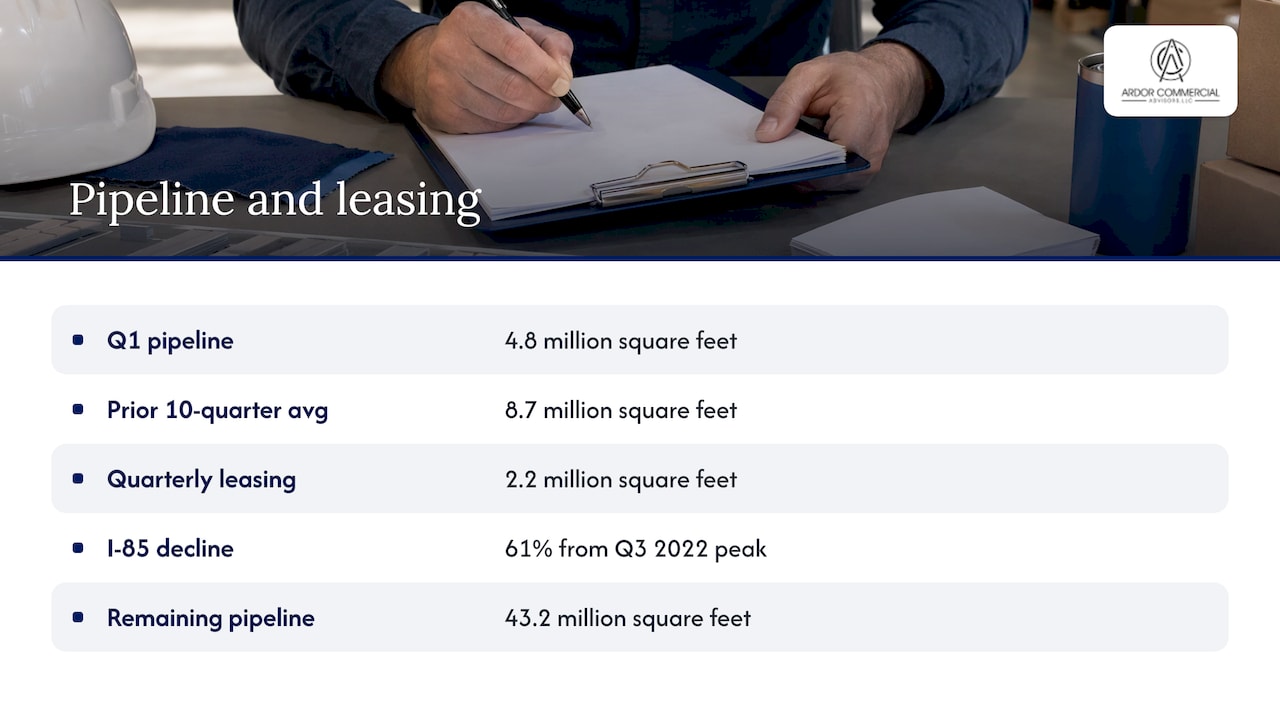
Fewer new buildings means fewer empty boxes arriving at once. Along the I-85 corridor, panelists at an industry event reported that the construction pipeline had fallen 61% from its third-quarter 2022 peak. Even so, 43.2 million square feet of new space remains in that pipeline, so supply has slowed but not stopped.
Demand is concentrated in newer buildings
The same REBusinessOnline report found that roughly 73% of 2025 leasing activity, nearly 6.8 million square feet, took place in Class A product. It also describes a widening performance gap: Class A vacancy has compressed from its 2024 peak, while demand for Class B and C buildings has softened.
For an owner, that gap is the story behind the average. A 2022-vintage building with 36-foot clear height and a good truck court competes in a different market from a 1990s building with low ceilings and limited dock doors.
Where the vacancy sits
The reports we rely on describe the pattern by building type more than by street address. Three segments matter:
| Segment | What the research shows | What it means |
|---|---|---|
| Large, newly delivered big-box | Direct vacancy in buildings over 500,000 SF was down more than 5% year over year in Q1 2026 per REBusinessOnline | Large blocks are leasing, but owners of recent deliveries can still face a long path to stabilize |
| Second-generation Class B/C | Demand softening as tenants trade up | Pricing power is weaker; renovations and realistic rents matter |
| Small-bay (under about 125,000 SF) | A development pipeline of roughly 1.5 million SF expected to deliver this year and another 2.2 million SF under construction, per Bisnow | Smaller users have more options coming, which tenants can use in negotiation |
If you want submarket-level detail for a specific address, the metro average is the wrong tool. Vacancy in the north, south, airport and I-85 corridors can differ meaningfully, and the answer depends on the size and age of the building you care about.
Power is the new constraint
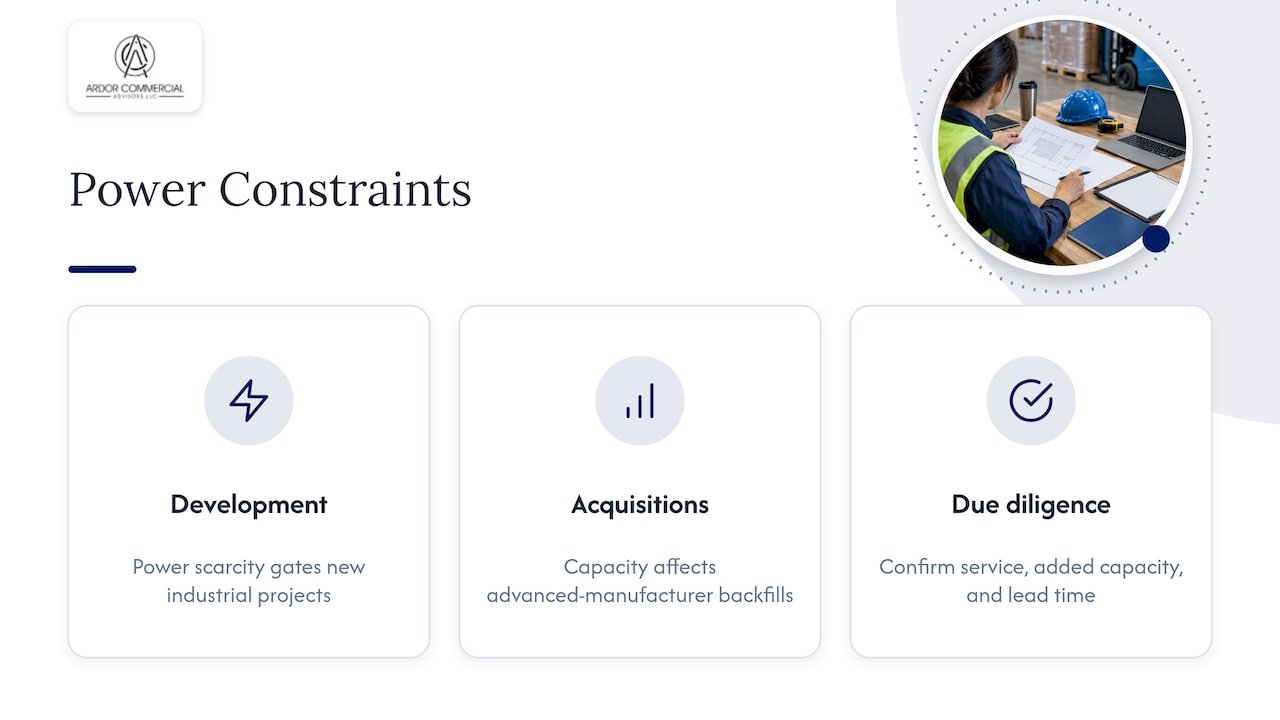
One of the more important findings in recent coverage has little to do with square footage. Bisnow reports that power scarcity poses problems for Charlotte industrial developers, even while leasing is strong and rent growth is stable. Utility access has become a gating factor for new industrial projects.
It matters for existing buildings too. At the InterFace conference, W. P. Carey managing director Tyler Swann said power capacity is now a critical metric in industrial acquisitions, because it determines whether an owner can backfill a vacated space with power-hungry advanced manufacturers.
For owners and buyers, that suggests a due-diligence habit: confirm the electrical service, the utility’s capacity to add more, and the lead time before you underwrite a re-leasing plan. When you are weighing a site layout or planning an upgrade, industrial site visualization in Charlotte can help you picture how power, truck courts and building footprint fit together before you commit capital.
What the vacancy trend means for you
If you own an industrial building
Your position depends on your building’s class and age. Owners of modern, well-located space have the stronger hand: the market is leasing Class A at a faster pace and vacancy there has been compressing. Owners of older buildings need a plan, whether that is pricing to the current rent level, upgrading, or selling to a user or investor who values the land and location.
Before you set an asking rent, check it against what tenants actually pay. Our pages on Charlotte industrial rents and warehouse lease rates in Charlotte lay out the ranges.
If you are thinking of buying or selling
Institutional capital continues to pursue high-quality logistics assets with durable tenancy, per REBusinessOnline’s August 2026 report. Buyers are paying for lease term, tenant credit, modern specs and power. A building with a short remaining lease and soft demand needs a different pricing conversation than a fully leased, newer asset.
A realistic value starts with a lease-by-lease review and a cash-flow model. That is the kind of work behind our commercial property valuation and DCF modeling service. If a 1031 exchange is part of the plan, our 1031 exchange rules guide covers the timing basics.
Financing changes the math as well. A lender sizes a loan on the building’s income, which is where the debt service coverage ratio for commercial real estate comes in. Lower vacancy and stable rents help a building clear a lender’s coverage test.
If you are a tenant looking for space
A 7.1% metro vacancy rate is not a landlord’s market everywhere. Tenants needing small-bay space have more new product coming, and tenants willing to consider second-generation buildings have more negotiating room. Big-box users, by contrast, are competing for a thinner supply of the best blocks.
What you want is the full cost, not just the base rent. Read how industrial lease types allocate taxes, insurance and maintenance, and how a triple net lease works. If you need a mix of office and warehouse, look at industrial flex space in Charlotte.
How to read the next vacancy report
When the next quarterly report comes out, run through this short checklist:
- Check the source and method. Is it direct vacancy or total availability including sublease? Does it track all buildings or only larger ones?
- Look at the period. Note the quarter the number applies to. The figure you read in a year will be a different one.
- Break it down by size and class. A flat metro rate can hide Class A tightening and Class B/C loosening at the same time.
- Compare with the pipeline. Falling construction numbers usually precede lower vacancy; rising ones do the opposite.
- Test it against your address. Your submarket, building height, dock count and power capacity are what decide your outcome.
Our perspective
We read vacancy numbers every quarter, and the same mistake shows up: owners and tenants quote the metro rate as if it described their building. It does not. A newer building near the interstate and a 1980s building on a secondary road are in two different markets, even with the same zip code.
Our approach is to start with the specific asset. We review the leases, model the cash flow, check what comparable space is truly leasing for, and then decide whether the right move is to lease, sell, hold or reposition. For tenants, we do the mirror image: we line up the real options, compare the full occupancy cost, and negotiate from the market data rather than from the asking rent.
The market is in a better place than it was a year ago. That is a good time to price a sale carefully, to renegotiate a renewal, or to commit to a lease on terms you can defend.
Jim
Get a building-level read on Charlotte industrial space
If you own, want to buy or need to lease industrial space in the Charlotte area, we handle sales and leasing, landlord and tenant representation, lease review and valuation work across the Charlotte metro. You can see the full list on our services page, or look at how tenant representation works with us.

We bring the local market data, the lease analysis and the negotiation support so your decision rests on your building, not on a metro average.
FAQ
What is the warehouse vacancy rate in Charlotte?
The Q3 2026 industrial vacancy rate was 7.1%, down from 7.9% a year earlier, per a report cited by Bisnow. Different data providers use different methods, so their numbers for the same quarter can differ. Compare figures from one source over time.
Is Charlotte warehouse vacancy going up or down?
It has been easing. Leasing activity in Q3 2026 was up 55.6% from the same period in 2025, and the construction pipeline has shrunk from its earlier peak. New supply still arrives, so the trend can shift with future deliveries.
Which warehouses are hardest to lease in Charlotte?
Older Class B and C buildings face softer demand, according to REBusinessOnline, while Class A space has been absorbing faster. Owners of recently delivered large buildings may also take longer to fill them. Building features such as clear height, docks and power matter most.
Does low vacancy mean rents will rise?
Not automatically. Rents follow the balance between leasing and new supply in your building type and submarket. Check what comparable space is actually leasing for, starting with our guide to warehouse lease rates in Charlotte.
Sources
- Power Scarcity Poses Problems For Charlotte Industrial Developers (Bisnow)
- Charlotte’s Industrial Market Enters a New Era of Disciplined Growth (REBusinessOnline)
- Utilities, Infrastructure Can Make or Break the Next Cycle of Industrial Development (REBusinessOnline)
- Best Industrial Rendering Companies in Charlotte, NC