
Cap rate tells you the income a property generates right now relative to its price; IRR tells you the annualized return across an entire hold, including leverage, timing, and the sale. Use cap rate to screen deals fast and compare them against the market. Use IRR, alongside equity multiple, when you’re building a full business plan or reporting to lenders and investors. The formulas and a worked example follow below.
TL;DR:
- A 50 basis point increase in exit cap rate can decrease projected IRR by approximately 3.5 percentage points, significantly impacting deal returns.
- Normalizing NOI with recent actuals and verifying exit cap assumptions against recent local sales prevent major underwriting errors.
- Use cap rate for quick deal screening and IRR along with equity multiple for comprehensive full-deal analysis and reporting.
- IRR calculations should incorporate actual cash flow timing and exit assumptions, preferably using XIRR for irregular cash flows.
- Analyzing multiple metrics together, including cap rate, IRR, and debt coverage, ensures a well-rounded understanding of deal risk and potential returns.
Table of Contents
- Cap Rate vs IRR: Defining the Two Metrics Investors Confuse Most
- How to Calculate Cap Rate and IRR Step by Step
- Cap Rate vs IRR: Where Each One Wins and Where Each Falls Short
- A Worked Example: Same Deal, Three Different Answers
- Where Underwriting Models Go Wrong
- Running Cap Rate and IRR Together in a Deal Workflow
- A Practical Checklist Before You Underwrite Your Next Deal
- What I’ve Learned Underwriting Charlotte Office and Medical Deals
- Get Underwriting Help From a Local Charlotte Team
- Sources
Cap Rate vs IRR: Defining the Two Metrics Investors Confuse Most
A cap rate is an unlevered, point-in-time yield: divide a property’s net operating income by its current market value, and you get a percentage that tells you what the asset earns today, independent of financing. A building with $500,000 in NOI selling for $8.3 million has a going-in cap rate of about 6%. It says nothing about tomorrow’s rent growth, next year’s refinance, or what happens at sale. That’s the trade-off: cap rate is fast and comparable across a market, but it’s a single snapshot.
IRR works differently. It’s the discount rate that makes the net present value of every cash flow equal zero, covering the entire hold period from initial equity outlay through annual distributions to the final sale. IRR bakes in time value of money, meaning a dollar received in year one is worth more than a dollar received in year five. That’s why two deals with identical five-year returns can post different IRRs if the cash flow timing differs.
A few terms show up constantly in this conversation, and mixing them up causes real underwriting mistakes:
- Unlevered vs. levered. Unlevered figures ignore debt entirely; levered figures reflect the loan, meaning levered IRR is usually higher (and riskier) than unlevered IRR.
- Equity multiple. Total cash returned divided by total cash invested. A 2.0x multiple means you doubled your equity, regardless of how long it took.
- Cash-on-cash return. Annual cash flow divided by equity invested, a simpler year-by-year cousin of IRR without the time-value math.
Keep those definitions straight and the rest of this comparison gets a lot easier to apply.
How to Calculate Cap Rate and IRR Step by Step
Cap rate math is short. Take the property’s trailing twelve months of NOI, divide it by the purchase price or current appraised value, and you have your answer. A medical office building generating $340,000 in NOI on a $5 million purchase price prices out to a 6.8% cap rate. The entire calculation lives in one line.
IRR takes more inputs because it’s modeling the whole deal, not one year of it.
- Lay out the initial equity investment as a negative cash flow in year zero.
- Add each year’s cash flow after debt service (for levered IRR) across the hold period.
- Add the net sale proceeds in the final year, after payoff of any remaining loan balance.
- Solve for the rate that sets the net present value of that full string to zero.
Nobody solves IRR by hand anymore. In Excel, the standard IRR function works for evenly spaced annual cash flows, but most real deals don’t close on tidy anniversary dates. That’s where XIRR earns its keep: it accounts for actual dates, so a deal that closes in March and sells in September still calculates correctly. Both functions use iterative approximation to converge on an answer, which is why an unusual cash flow pattern, like a heavy capital call mid hold, can throw a #NUM! error if Excel can’t find a solution.
Pro Tip: If IRR or XIRR returns a #NUM! It gives Excel a starting point closer to the real answer and usually resolves the convergence failure.
Cap Rate vs IRR: Where Each One Wins and Where Each Falls Short
Cap rate is a screening tool. When a broker sends you ten office listings across the Charlotte MSA, cap rate lets you rank them in minutes without building ten cash flow models. It’s also the language the market speaks: appraisers, lenders, and brokers all quote cap rate first because it’s comparable across properties instantly.
IRR is a business-plan metric. It only means something once you’ve modeled the hold, and that’s exactly why lenders and limited partners lean on it for reporting; it reflects what actually happens to their capital, not just what the asset yields on day one. A property with a low going-in cap rate can still post a strong IRR if rents grow faster than the market expects, or if a value-add renovation lifts NOI meaningfully before the sale.
The blind spots run in opposite directions:
- Cap rate ignores leverage entirely, timing of cash flows, and what happens at exit, so it can make a deal with deteriorating fundamentals look fine on paper.
- IRR ignores deal size. A $50,000 flip that returns 40% IRR and a $10 million redevelopment that returns 18% IRR are not equivalent outcomes, even though the smaller deal’s rate looks better.
That size blind spot is why IRR should never travel alone. Pair it with equity multiple so stakeholders see actual dollars, not just a rate. When you’re pitching a lender, lead with cap rate and debt service coverage. When you’re pitching an LP, lead with levered IRR and equity multiple, and keep cap rate in the appendix as market context.
A Worked Example: Same Deal, Three Different Answers
Here’s a single-tenant medical office deal modeled three ways, using assumptions typical of a Charlotte-area acquisition.
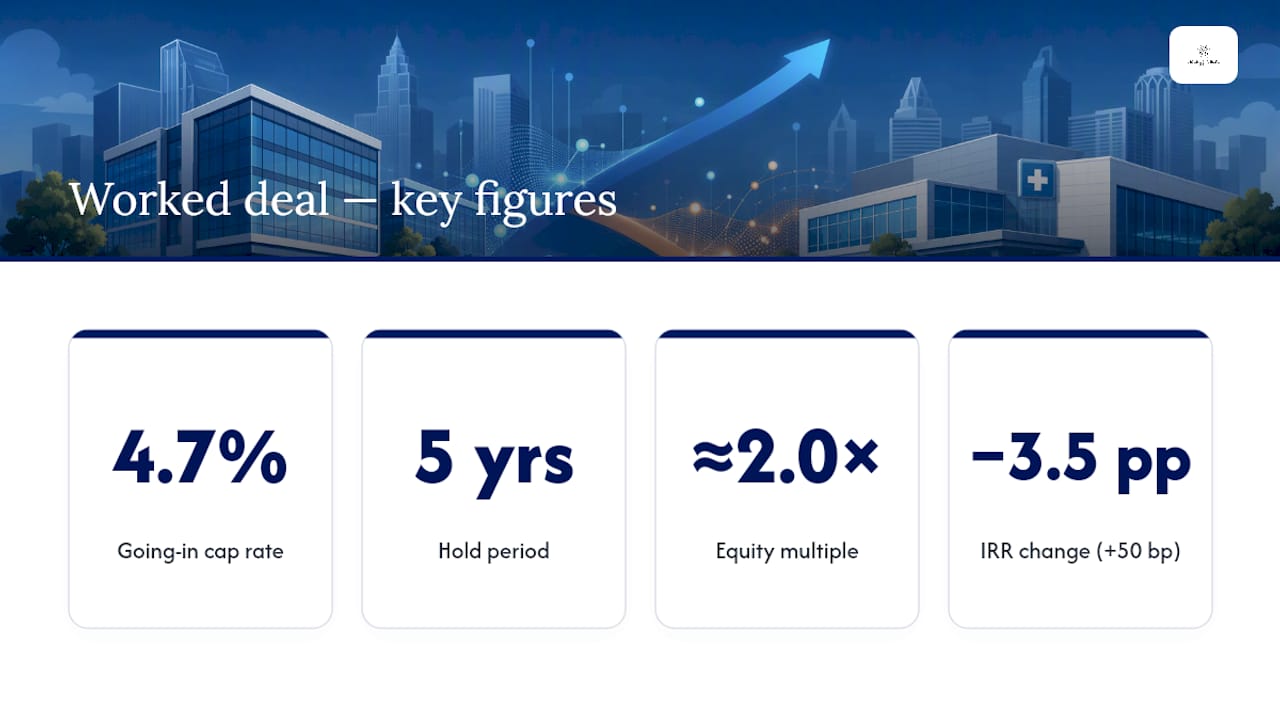
The going-in cap rate is $390,000 divided by $8.3 million, or within the commonly observed range of about 5% to 10%. That number alone tells a lender the deal is priced in line with the market. It tells an investor almost nothing about what they’ll walk away with.
Model the full hold, and the picture changes. With a typical equity investment share, interest-only debt service, and assumed NOI growth annually, the property sells in year five at roughly the same exit cap. Run those cash flows through XIRR and the levered IRR lands in a range consistent with common investor expectations, with an equity multiple meaning investors get back nearly double their invested capital over five years.
That’s a swing of more than three percentage points of annualized return from a single half-point move in one assumption.
On this deal, a 50 basis-point increase in exit cap rate cut projected IRR by roughly 3.5 percentage points, which lines up with the broader pattern that exit cap assumptions often drive the majority of proceeds on a multi-year hold. Cap rate never saw that risk coming. IRR did, because it’s built to.
Where Underwriting Models Go Wrong
Most IRR mistakes trace back to one of three sources: an inflated NOI, an unrealistic exit cap, or sloppy handling of cash flow timing.
NOI normalization is the first place to check. Pro-forma NOI from a broker’s offering memorandum often assumes a rent bump or expense reduction that hasn’t happened yet. Compare it against trailing actuals, and if you use pro-forma numbers, document exactly which line items are projected versus historical. Errors here flow straight into both cap rate and IRR, since both metrics start with NOI.
Exit cap risk deserves its own line of scrutiny, especially on value-add deals where the first two years often run cash-flow-compressed during renovation. If your model assumes the exit cap rate compresses below the going-in rate, you’re betting on the market improving in your favor. That’s a real possibility, but it should be stated as an assumption, not buried in a spreadsheet cell.
A short checklist keeps these errors from slipping through:
- Normalize NOI against trailing actuals, not just broker pro-formas.
- Label every IRR output as levered or unlevered; never mix the two in a report without a clear tag.
- Use XIRR instead of IRR whenever cash flows land on irregular dates.
- Consider MIRR if you’re uncomfortable with IRR’s assumption that interim cash flows get reinvested at the same rate.
Pro Tip: Run your exit cap assumption against actual recent comps in the submarket, not against your entry cap rate. If your exit cap is lower than every comparable sale in the last 18 months, you’re underwriting a bet on cap rate compression, whether you meant to or not.
Running Cap Rate and IRR Together in a Deal Workflow
The two metrics work best in sequence, not in isolation. A practical process looks like this:
- Screen every deal on cap rate first, comparing it against current market comps to filter out mispriced listings quickly.
- Build a full cash flow model for anything that clears the screen, solving for levered and unlevered IRR alongside equity multiple.
- Document every assumption, financing terms, rent growth, vacancy, exit cap, in a table attached to the model, not buried in a formula.
- Run sensitivity tables on exit cap rate and hold period before presenting any number as final.
Different stakeholders want different outputs. Lenders care about debt service coverage and unlevered metrics because they’re evaluating the asset, not your equity structure. LPs want levered IRR and equity multiple because that’s what happens to their check. Brokers and appraisers speak almost exclusively in cap rate.
Before recommending any deal, an analyst should have at minimum: a going-in cap rate, a levered and unlevered IRR, an equity multiple, and one sensitivity table showing how IRR moves with exit cap rate. Anything less leaves a gap someone on the other side of the table will find.
A Practical Checklist Before You Underwrite Your Next Deal
Turn the above into a repeatable process and you cut down on the kind of errors that surface only after closing.
- Verify NOI against trailing twelve-month actuals, and flag every pro-forma adjustment separately.
- Confirm financing terms and debt service coverage ratio align with lender requirements before modeling levered returns; Ardorcre’s DSCR loan sizing guide walks through how lenders size proceeds against cash flow.
- Document exit cap comps from actual recent sales in the submarket, not assumed compression.
- Compute both levered and unlevered IRR, plus equity multiple, for every deal that clears initial screening.
- Run sensitivity on exit cap and hold period, and keep both the base case and downside case in your reporting.
- Cross-check rent and lease assumptions against the actual lease terms; a lease abstract catches escalation clauses and expense reimbursements that get missed when someone eyeballs a rent roll.
Multi-tenant buildings add another layer worth checking before you finalize NOI: rollover risk on multiple lease expirations can compress the exit cap comp set, since buyers price vacancy risk differently across a single-tenant versus multi-tenant asset. Confirm which comp set actually applies before locking your exit assumption.
What I’ve Learned Underwriting Charlotte Office and Medical Deals
Office and medical-office deals in the Charlotte MSA punish anyone who treats cap rate as the whole story. Medical tenants sign long leases with real tenant improvement investment behind them, which makes the income look stable on a cap rate basis. But the exit, five or seven years out, depends entirely on whether that tenant renews, and that’s an IRR question, not a cap rate question.
My practice on every deal: pull the last 12 to 18 months of actual submarket sales before locking an exit cap assumption, then document the variance if my model’s exit cap sits outside that range. If it’s a value-add medical office with in-place TI amortized into rent, I run the IRR sensitivity on cap rate movement first, since that’s the assumption most likely to be wrong. Cap rate gets you into the conversation. IRR and equity multiple decide whether you actually want the deal.
— Jim
Get Underwriting Help From a Local Charlotte Team
Building a defensible IRR model takes more than a spreadsheet template. It takes financing terms that actually match what lenders will underwrite, lease assumptions pulled from real documents, and exit comps from deals that closed nearby, not national averages. A local team works with office, medical, retail, and industrial investors across the Charlotte MSA providing sales, leasing, and advisory services grounded in local transaction data rather than guesswork.

If you’re sizing debt for a levered IRR model, start with Ardorcre’s DSCR loan sizing guide to see how lenders will actually size your proceeds against projected cash flow before you finalize your equity requirement. Whether you’re evaluating a medical office acquisition, weighing a sale against a refinance, or comparing a multi-tenant building case against a single-tenant deal, reach out to Ardorcre’s advisory team to walk through your assumptions before you commit capital.
Sources
- Capitalization rate (cap rate) definition — Investopedia
- Internal rate of return (IRR) — Corporate Finance Institute
- Cap Rate vs IRR: How to Use Both in CRE Underwriting — AcquiOS
- IRR function — Microsoft Support