
Run direct capitalization first if you own a stabilized, income-producing property and need a fast, defensible number: divide net operating income by a market cap rate. If your leases are turning over, you’re planning renovations, or you’re holding for five-plus years, build a discounted cash flow (DCF) model instead. If you have three to five truly comparable sales from the past six to twelve months, sales comparison will likely give the sharpest number. New construction or a special-purpose building (a church, a self-storage facility, a data center) usually calls for the cost approach.
For most owners weighing a near-term decision, here’s the practical move: run a quick direct-cap estimate using forward-looking NOI and a market cap rate pulled from recent local sales. If you’re within six months of listing, skip the DIY math and request a broker opinion of value instead. It costs little or nothing and reflects what buyers are actually paying today, not what a spreadsheet says they should.
Before you run any numbers, gather three things:
- Current rent roll and vacancy schedule, including lease start/end dates and any upcoming rollovers.
- Trailing 12 months of operating expenses, separated from any debt service or ownership-level costs.
- Three to five recent comparable sales in your submarket and asset class, ideally closed within the last year.
Once you have those, the single formula to run first is NOI divided by your market cap rate. If the result seems inconsistent with what similar buildings nearby have sold for, or if a major tenant’s lease expires within 18 months, stop and call a broker or appraiser before you rely on the number for anything material.
Pro Tip: Owners routinely hand over trailing NOI that includes a one-time expense credit, a below-market renewal, or a vacancy concession baked into the rent roll. Strip those out before you calculate anything. A single miscoded lease can swing an estimate by six figures on a mid-size building.
Key Takeaways
A defensible commercial property valuation comes from matching the right method (income, sales comparison, or cost) to your asset and situation, then cross-checking the result before you act on it.
| Point | Details |
|---|---|
| Start with direct capitalization | Divide forward-looking NOI by a market cap rate for a fast read on stabilized assets. |
| Switch to DCF for changing income | Use discounted cash flow when leases are rolling over or you’re planning renovations. |
| Never trust a single method | Cross-check at least two approaches, especially before a sale, refinance, or lender submission. |
| Match the product to the need | Choose a BOV for pre-listing pricing, an appraisal for lender or legal requirements, a consultant for complex modeling. |
| Filter out distortions first | Strip non-market rents, concessions, and stale comps before relying on any number. |
| Get local expertise for the next step | Ardorcre prepares BOVs and coordinates appraisals for owners across the Charlotte MSA moving from estimate to transaction. |
Table of Contents
- What Does Commercial Property Valuation Actually Measure?
- Income Approach: Direct Capitalization vs. Discounted Cash Flow
- How Do You Find and Adjust Comparable Sales?
- When Does the Cost Approach Make Sense?
- Which Quick Formulas Screen a Deal Fastest?
- How Do You Reconcile Multiple Valuation Approaches?
- BOV vs. Appraisal vs. Consultant: Which One Do You Need?
- What Should You Prepare Before Requesting a Valuation?
- What Mistakes Quietly Wreck a Valuation?
- Which Method Dominates by Property Type?
- What Owners Get Wrong About Valuation, and What Actually Works
- How Ardorcre Supports Owners Through the Valuation Process
- Frequently Asked Questions
- Sources
What Does Commercial Property Valuation Actually Measure?
Commercial property valuation estimates the price a property would command in an open market transaction between a willing buyer and willing seller, neither one under pressure to act. The International Valuation Standards (IVS) definition of market value is specific: it’s a time-stamped estimate, made at arm’s length, that excludes any price inflated or deflated by special financing, a forced sale, or a below-market concession granted to close a deal fast. That distinction matters more than most owners realize, because sale prices you see in the news or hear about from a neighboring landlord often include exactly those distortions.
A handful of drivers move that number, and you either control them directly or need to report them accurately to whoever is running the analysis.
- Net operating income (NOI): total revenue minus operating expenses, before any debt service or capital improvements.
- Cap rate: the market’s required return for that asset class and risk profile, derived from recent sales.
- Occupancy and lease structure: who’s in the building, how long they’re staying, and on what terms.
- Tenant credit quality: a national credit tenant on a 10-year lease supports a lower cap rate than a month-to-month local operator.
- Lease expirations: a wall of rollovers in the next 24 months changes the risk profile even if current occupancy looks fine.
- Location and market cycle: submarket demand, absorption trends, and where the broader cycle sits (rising rents versus softening).
- Replacement cost and physical condition: deferred maintenance and functional obsolescence both erode value independent of income.
NOI itself is simpler than most owners expect but easy to get wrong: revenue (rent plus reimbursements and other income) minus operating expenses (property taxes, insurance, management, repairs, utilities not passed through). It excludes debt service and capital expenditures entirely. The other trap is confusing contract rent, what a tenant is actually paying under their lease, with market rent, what a new tenant would pay today. If your anchor tenant signed five years ago at below-market rates, your NOI understates what the space is really worth on renewal, and any buyer’s underwriting will adjust for that gap whether you do or not.
Income Approach: Direct Capitalization vs. Discounted Cash Flow
Use direct capitalization when you have a stabilized property and one year of NOI genuinely represents ongoing performance. Use DCF when income is changing, whether from lease rollovers, a planned renovation, rent steps, or a lease-up period, because a single-year snapshot will mislead you in either direction.
Direct capitalization is a one-line formula:
Value = NOI ÷ Cap Rate
You derive the cap rate from recent comparable sales in the same asset class and submarket, adjusting for property-specific risk. If a similar industrial building just sold with a $400,000 NOI at a $5.2 million price, that’s roughly a 7.7% cap rate, and you’d apply a similar rate to your own stabilized NOI, adjusted up or down for tenant quality, building age, and location.
DCF (yield capitalization) takes more work but earns its keep for anything with a changing income story. You project NOI year by year across a hold period, typically five to ten years, estimate a terminal value at sale using an exit cap rate, and discount everything back to present value using a required rate of return. DCF explicitly models lease rollovers, rent growth, and capital expenditures rather than betting the whole valuation on one year’s income, which is exactly why lenders and institutional buyers lean on it for longer holds or volatile assets.
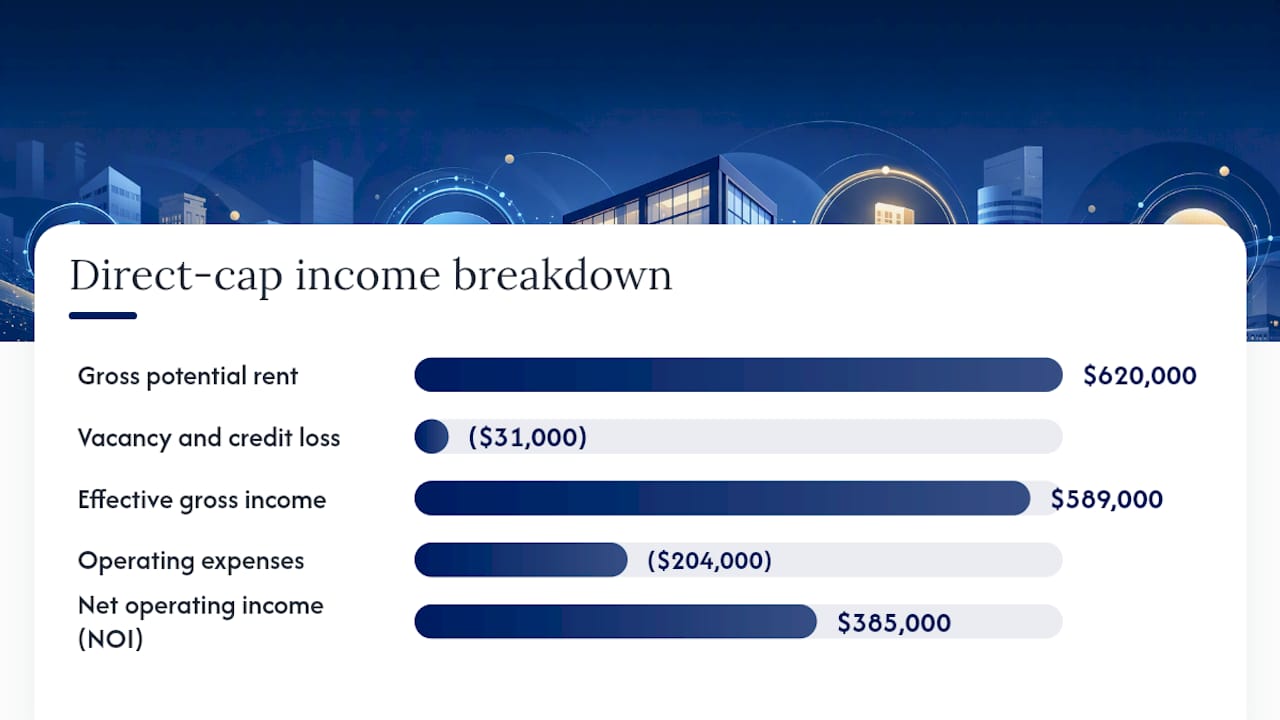
Here’s a worked example using direct capitalization on a small medical office building:
| Input | Value |
|---|---|
| Gross potential rent | $620,000 |
| Vacancy and credit loss (5%) | ($31,000) |
| Effective gross income | $589,000 |
| Operating expenses | ($204,000) |
| Net operating income (NOI) | $385,000 |
| Market cap rate | 7.25% |
Run the math step by step:
- Start with effective gross income: $620,000 minus $31,000 vacancy loss equals $589,000.
- Subtract operating expenses: $589,000 minus $204,000 equals $385,000 in NOI.
- Divide NOI by the cap rate: $385,000 ÷ 0.0725 = $5,310,345, rounded to roughly $5.31 million.
If that same building had two major tenants (representing 40% of rent) rolling over in 18 months at below-market rates, a DCF sketch would instead project a dip in year two NOI as those leases reset to market, then a recovery, before discounting the whole stream plus a terminal value back to today. The direct-cap number in that scenario overstates value because it assumes the current NOI holds steady indefinitely, which it won’t.
Two mistakes come up constantly. First, using trailing 12-month NOI without checking whether it reflects a temporarily vacant suite or an expired lease that hasn’t yet rolled to market. Second, ignoring capital expenditure needs, a building with a roof replacement due next year isn’t worth the same as an identical building with a new roof, even if both show the same NOI today.
Pro Tip: Ask whoever ran your comps how they derived the cap rate. “Average of five sales” and “adjusted for tenant credit and lease term” are very different levels of rigor, and the gap shows up directly in your number.
Direct cap wins on speed and simplicity, and lenders often want to see it as a sanity check even when they’re underwriting off DCF. DCF wins on defensibility for anything with a real income story, but it’s only as good as your assumptions, garbage rent growth projections produce garbage valuations no matter how sophisticated the spreadsheet looks.
How Do You Find and Adjust Comparable Sales?
Sales comparison works best when you can find three to five recent, genuinely similar sales in your submarket, ideally closed within the last six to twelve months. Same asset class, similar size, similar age and condition. In transactional markets like retail strip centers or small office buildings, where trades happen frequently, sales comparison often produces a sharper number than the income approach alone.
The screening step matters as much as the adjustment math. Before you trust any comp, confirm it was an arm’s-length transaction, not a sale between related parties, not a distressed or foreclosure sale, and not a sale-leaseback with unusual financing terms baked into the price. Those transactions get reported in the same databases as clean market sales, and they’ll skew your number if you don’t filter them out.
Once you’ve got a clean comp set, you adjust for the differences that actually move price:
- Size: smaller buildings often trade at a higher price per square foot than larger ones in the same submarket.
- Location and submarket: even blocks apart can carry meaningfully different demand.
- Age and condition: a 1990s building with recent capital improvements competes differently than a dated one.
- Cap rate or yield differences: if the comp had stronger in-place income, its price reflects that.
- Tenant mix and credit quality: a comp anchored by a national credit tenant isn’t a clean match for a building full of local month-to-month operators.
- Lease term differences: longer remaining lease term generally supports a higher price.
Here’s how that plays out. Say a comparable retail building sold for $2.4 million at 12,000 square feet, or $200 per square foot. Your subject property is 9,500 square feet with a materially shorter average remaining lease term across its tenant roster. You might apply a 5% upward adjustment for the smaller size (smaller retail buildings often command a premium per foot) and a 4% downward adjustment for the weaker lease term profile, netting to roughly $202 per square foot applied to your building, or approximately $1.92 million.
If a broker or appraiser hands you a comp set, run it through this checklist before you accept the conclusion:
- Were all comps confirmed as arm’s-length sales, with no distress or related-party red flags?
- Do the sale dates fall within the last 6 to 12 months, or has the market moved enough since then to matter?
- Are the adjustment percentages explained, or just asserted?
- Does the implied price per square foot align roughly with what you’d expect from the income approach on the same property?
When Does the Cost Approach Make Sense?
Use the cost approach when the property is new construction, a special-purpose building with few if any comparable sales, or when both income data and comps are too thin to trust. Think self-storage facilities, houses of worship, or a purpose-built manufacturing plant. Insurance replacement estimates also lean almost entirely on this method.

The formula:
Value = (Replacement Cost New − Depreciation) + Land Value
Replacement cost new is what it would cost today to build an equivalent structure using current materials and labor rates, sourced from cost-estimating services or contractor bids. Land value gets estimated separately, typically through comparable land sales in the immediate area. Depreciation is where the real judgment comes in, and it breaks into three categories:
- Physical depreciation: wear and tear from age, deferred maintenance, or a system nearing end of life.
- Functional obsolescence: outdated layout or design that no longer serves the market, like inadequate ceiling heights in an old industrial building.
- External obsolescence: value loss from factors outside the property itself, a declining submarket or new competing supply nearby.
A quick example: a special-purpose manufacturing building might carry a replacement cost new of $3.8 million. If the building is 15 years into a projected 40-year useful life with moderate deferred maintenance, you might estimate 30% physical depreciation, or $1,140,000, bringing depreciated building value to —. Add a land value of $650,000, and you land at roughly $3.31 million.
The cost approach tends to lose relevance fast as a building ages past its midlife, since depreciation estimates get more subjective the further you are from new construction. Lenders rarely lean on it alone for anything beyond ground-up construction financing or insurance purposes.
Which Quick Formulas Screen a Deal Fastest?
Before you commit real time to a full valuation, four shorthand formulas let you triage a deal in minutes. None of them substitute for a proper income or comparison analysis, but they’ll tell you whether a property is even worth deeper diligence.
| Shortcut | Formula | Best for | What it misses |
|---|---|---|---|
| Cap rate shorthand | NOI ÷ Purchase Price | Quick yield comparison across listings | Lease rollover risk, capex needs |
| Gross rent multiplier (GRM) | Price ÷ Gross Annual Rent | Fast screening of small multifamily or retail | Operating expenses entirely |
| Price per square foot | Price ÷ Building Square Footage | Comparing similar building types in one submarket | Tenant quality, lease terms, condition |
| Value per door | Price ÷ Number of Units | Multifamily quick comparisons | Unit mix, amenity differences |
Say you’re screening a 20-unit apartment building listed at $2.6 million with $340,000 in gross annual rent. That’s a GRM of roughly 7.6. If comparable properties in the submarket are trading at a GRM of 8.5 to 9, this one looks cheap on the surface, worth a closer look at why. Maybe operating expenses run unusually high, or maybe it’s genuinely underpriced. GRM alone won’t tell you which, since it ignores expenses completely. Price per square foot works similarly as a screening tool for office or retail, but it breaks down fast on institutional-grade assets or owner-occupied buildings where there’s no rental income to benchmark against in the first place. Automated online calculators that spit out an instant number are built on these same shortcuts, treat the output as a starting point for research, never as a number you’d take to a lender or a closing table.
How Do You Reconcile Multiple Valuation Approaches?
A defensible valuation isn’t a single number pulled from one method. It’s a weighted reconciliation of every approach that genuinely applies, reported as a range with a clear rationale for how much weight each method carried.
Here’s the process professionals actually follow:
- Run every applicable method. If you have solid comps, decent income data, and reasonable cost data, calculate all three rather than picking one and stopping.
- Assess data quality for each. Thin comp sets, unstable NOI, or outdated cost estimates should all pull weight away from that method’s result.
- Assign weights based on reliability, not convenience. A stabilized office building with five strong comps and a clean rent roll might weight sales comparison and income approach at 40% each, cost approach at 20%.
- Test sensitivity before finalizing. Flex your cap rate or NOI assumptions up and down slightly and see how much the number moves.
That last step matters more than owners tend to appreciate. A quarter-point shift in cap rate, say from 7.0% to 7.25%, on a property with $400,000 NOI moves the indicated value from roughly $5.71 million down to about $5.52 million, a difference exceeding 3% from a change that small. Small assumption changes compound into material dollar swings fast, which is exactly why lenders ask for sensitivity tables rather than a single point estimate.
Document your assumptions as you go: the cap rate source and date, comp selection criteria, NOI adjustments and why you made them, and any capital items excluded from operating expenses. A summary report built this way, even a simple one, holds up far better under buyer or lender scrutiny than a single unexplained number.
BOV vs. Appraisal vs. Consultant: Which One Do You Need?
Pick a broker opinion of value when you need a fast, low-cost market read before listing a property or testing pricing. Pick a formal appraisal when a lender, court, or tax authority requires a defensible third-party number. Pick a valuation consultant when you’re modeling a complex hold, forecasting a portfolio, or building out a full DCF for an institutional decision.
The distinction between a BOV and an appraisal isn’t just about cost. A BOV is a market-driven estimate prepared by a broker using recent comps and local demand knowledge, often free or low-cost and turned around in days. An appraisal is a formal valuation prepared by a state-licensed appraiser following USPAP standards, and it’s the version lenders and courts require at closing because it carries independent, regulatory-backed weight that a broker’s opinion doesn’t.
| Product | Typical cost | Turnaround | Core purpose |
|---|---|---|---|
| Broker Opinion of Value (BOV) | Often free to low-cost | Days | Pre-listing pricing, quick market read |
| Formal appraisal | Several thousand dollars, scaling with property complexity | 2 to 6 weeks | Lender, legal, or tax requirements |
| Valuation consultant | Fee-based, scoped to project | Varies by engagement complexity | DCF modeling, portfolio valuation, complex forecasting |
If you’re selling within the next few months and just need a realistic listing price, a BOV gets you there fast and usually free through a broker who already works your asset class. If you’re refinancing, closing a sale that requires lender financing, or dealing with a tax or legal dispute, you’ll need a licensed appraiser regardless of what a broker’s opinion says, because that’s what the other side of the transaction requires. For anything involving multiple properties, complex lease structures, or long-hold DCF modeling, a consultant engagement, though the most expensive and slowest route, produces the depth of analysis that a quick BOV or standard appraisal isn’t built for.
What Should You Prepare Before Requesting a Valuation?
Whether you’re calling a broker for a BOV or engaging a licensed appraiser, the materials you hand over determine how fast and how accurate the result comes back. Assemble these before you make the call:
- Current rent roll, with tenant names, square footage, lease start and end dates, and rental rates.
- 12 months of operating statements, itemized by expense category.
- Copies of major leases, especially anything with unusual terms, free rent periods, or tenant improvement allowances.
- Capital expenditure history, roof, HVAC, parking lot, and any major systems replaced or due for replacement.
- Recent inspection or condition reports, if you have them.
When you send that package to a broker or appraiser, be explicit about the purpose of the valuation, since a number built for internal planning looks different from one built for a lender or a tax appeal. Ask them directly how many comps they’ll pull, whether their cap rate comes from a market database or recent closed transactions they’ve personally tracked, how long turnaround will take, and what the fee structure looks like before you commit.
A short questionnaire worth running through with any broker or appraiser you’re vetting:
- How many transactions have you closed or appraised in this specific asset class in the last two years?
- What comp database or market data source do you rely on?
- How do you source and adjust your cap rate?
- What’s your typical turnaround time for this scope of work?
- Is your fee flat, hourly, or contingent on outcome?
Pro Tip: Disclose every lease concession up front, free rent months, below-market renewal options, tenant improvement allowances above market norm. A valuer who doesn’t know about these will either bake them into the number incorrectly or, worse, produce a value that collapses the moment a buyer’s due diligence team finds them.
For lease-heavy properties, pulling a clean lease abstract before you start this process saves real time, since it forces you to separate contract terms from what the market would actually pay today.
What Mistakes Quietly Wreck a Valuation?
A handful of errors show up again and again, and each one produces a number that looks precise but is quietly wrong.
- Using trailing NOI without adjustment. If a suite sat vacant for three months last year or a lease just rolled to a below-market renewal, trailing NOI doesn’t represent go-forward performance. Fix: build a stabilized, forward-looking NOI that reflects current occupancy and market rents.
- Including non-market rents or concessions. A rent roll with a friends-and-family tenant at half market rate, or a lease with three free months baked into year one, distorts income-based methods. Fix: normalize every lease to market terms before running the math, and flag concessions separately.
- Relying on a single method. Sales comparison alone ignores income fundamentals; income approach alone ignores what buyers are actually paying nearby. Fix: run at least two methods and reconcile the gap.
- Confusing assessed or tax value with market value. County tax assessments lag the market by years and use their own formulas, they’re not a proxy for what a buyer would pay. Fix: treat tax value as background context only, never as your baseline number.
- Using stale comps. A comp from three years ago in a market that’s since repriced 15% tells you almost nothing useful today. Fix: limit your comp set to the last 6 to 12 months, or explicitly adjust for market movement since the sale.
The one-sentence rule that covers most of this: if the number is going to drive a sale, refinance, or major capital decision, always cross-check at least two methods, or get a second opinion from someone who didn’t produce the first number.
Which Method Dominates by Property Type?
Professionals don’t apply the same weighting to every asset class or every stage of a property’s life. Income approaches carry the most weight for stabilized, income-producing assets, multifamily, industrial, and most office buildings, because their value is fundamentally a function of the cash flow they throw off. Sales comparison dominates in markets with frequent trades, small retail strips, single-tenant net-lease buildings, small office properties, where enough recent transactions exist to build a tight comp set. Cost approach takes over for new construction and special-purpose properties where neither income data nor comps are reliable.
| Asset class / stage | Primary method | Why |
|---|---|---|
| Stabilized multifamily | Income (direct cap or DCF) | Predictable rent roll and expense structure drive value directly |
| Industrial, single-tenant | Income (direct cap) | Long leases and credit tenants make NOI the clearest signal |
| Small retail strip / net-lease | Sales comparison | High transaction volume produces reliable comps |
| New construction | Cost approach | No stabilized income history and often no direct comps |
| Special-purpose (self-storage, worship space) | Cost approach | Few comparable sales exist for the specific use |
| Redevelopment / near-term lease expirations | Blended, multiple methods weighted equally | Current income doesn’t reflect future highest-and-best use |
The exception worth flagging: redevelopment plays and buildings with major leases expiring soon don’t fit neatly into any single method. A building generating solid NOI today but losing its anchor tenant in 14 months needs income analysis, sales comparison for the underlying land or shell value, and often a cost-based read on what redevelopment would actually require, weighted together rather than picked from.
What Owners Get Wrong About Valuation, and What Actually Works
Most owners I talk with want a single number, fast, and they want it to confirm what they already believe the property is worth. That instinct is understandable and almost always counterproductive. The properties that sell at or above expectation are the ones where the owner ran a direct-cap estimate early, cleaned up their rent roll and expense reporting, then requested a BOV from a broker who actually works their asset class in their submarket before listing.
The pattern I see most often at Ardorcre, working office, medical, retail, and industrial assets across the Charlotte MSA, is owners who skip straight to an appraisal because it sounds more official, when a same-week BOV would have told them nearly the same thing for free and let them fix pricing or lease issues before a lender or buyer ever saw the number. Appraisals earn their cost and their two-to-six-week timeline when a closing or lender requires one. They’re the wrong first step for someone still deciding whether to sell.
The other pattern worth naming: owners who treat their own comps as gospel because a neighboring building sold for a certain price per foot, without checking whether that sale involved a sale-leaseback, a distressed seller, or lease terms nothing like their own. A comp set built by someone who actually closes deals in that asset class catches those distortions before they end up in your number.
How Ardorcre Supports Owners Through the Valuation Process
Getting a defensible number is one thing. Acting on it, listing, refinancing, or holding, is where most owners actually need help. Ardorcre works with commercial property owners and investors across the Charlotte MSA on exactly this handoff: BOV preparation for owners weighing a sale, appraisal coordination when a lender or closing requires a licensed third party, and DCF modeling or portfolio-level valuation work for owners managing multiple assets or planning a longer hold.

Timing and cost track what you’d expect from the methods above. A BOV from an Ardorcre advisor typically turns around within days and costs nothing if you’re evaluating a potential listing. Appraisal coordination, connecting you with a licensed appraiser and packaging your rent roll, operating statements, and lease abstracts so the process moves faster, fits into that same two-to-six-week appraisal window. Deeper advisory work, DCF modeling for a long-hold decision or a portfolio-wide valuation review, gets scoped and priced to the specific engagement.
If your NOI number feels shaky, Ardorcre’s property management budget guide walks through the operating expense categories that most often get miscoded before a valuation. If you’re ready to move, request a broker opinion of value or schedule a valuation scoping call through Ardorcre’s commercial real estate services page to get a straight answer on where your property stands and what to do next.
Frequently Asked Questions
What’s the difference between a broker opinion of value and a commercial real estate appraisal?
A BOV is a market-driven estimate prepared by a broker, often free and delivered within days, based on recent comps and local demand. A formal appraisal follows USPAP standards, is prepared by a state-licensed appraiser, and is the version lenders, courts, and tax authorities require because it carries independent regulatory weight a broker’s opinion doesn’t.
How do I calculate NOI for a commercial property?
Add up all rental income and reimbursements, then subtract operating expenses, property taxes, insurance, management fees, repairs, and utilities not passed through to tenants. Leave out debt service and capital expenditures entirely; those sit below the NOI line.
Is direct capitalization or DCF more accurate for investment property valuation?
Neither is universally more accurate. Direct capitalization works well when one year of NOI genuinely represents ongoing performance. DCF is the better tool when income is changing from lease rollovers, planned capital improvements, or a multi-year hold with shifting rent growth assumptions.
How many comparable sales do I need for the sales comparison approach?
Three to five recent, truly similar sales, ideally closed within the last six to twelve months, in the same asset class, size range, and submarket, gives you a defensible comp set for most commercial property types.
What does a commercial appraisal typically cost and how long does it take?
Costs typically run into the thousands of dollars and scale with property size and complexity, while turnaround usually falls between two and six weeks. A broker opinion of value, by comparison, is often free or low-cost and can turn around in a matter of days.
Should I trust an online commercial property valuation calculator?
Treat an automated calculator as a rough starting point only. These tools apply simplified income-cap formulas and can’t account for lease-specific terms, tenant credit quality, or upcoming rollovers the way a broker or appraiser working your actual rent roll can.
This article is general information, not a substitute for advice from a qualified financial advisor. Consult a qualified financial professional about your own circumstances before acting on anything here.
Sources
Owners who want to dig deeper into the standards and methodology behind these numbers can start with these sources:
- Broker opinion of value vs appraisal