
Plan on a moderate amount of usable area per employee as your baseline, then adjust for office type, hybrid attendance, and shared amenities. That range is where most planning conversations start, whether you’re sizing a 20-person startup suite or a 200-person corporate floor. The one-line formula to get from that target to a leasable number: Total Rentable Area = (Per-Employee Target × Peak Daily Headcount × Shared-Area Multiplier) ÷ Usable-to-Rentable Ratio. Run that calculation before you tour a single space. The worked examples in Section 7 show exactly how it plays out for three common team sizes.
Federal accessibility and occupant protection requirements from HUD affect minimum clearances and restroom counts, which eat into your usable area before you assign a single desk. Factor those in early. Corporate return-to-office policies, like the four-day mandate Disney announced, directly shape your peak-day attendance assumption, which is the single most consequential input in the formula. Get that number wrong and every downstream calculation is off.
Key Takeaways
The most defensible office space plan starts with a 100–175 sq ft usable target per employee, converts that to rentable area using peak attendance and load factor, and treats the result as a living number that updates as utilization data comes in.
| Point | Details |
|---|---|
| Baseline planning range | Budget 100–175 sq ft of usable area per employee, adjusted for density model and office type. |
| Core formula | Rentable Area = Per-Person Target × Peak Headcount × Shared Multiplier × Load Factor. |
| Use peak headcount, not total | Base calculations on your busiest-day attendance, not total employee count. |
| Desk-sharing floor | Don’t drop below a 0.8:1 desk ratio without 90 days of badge-swipe data supporting it. |
| Call a broker at 18 months | Engage a commercial broker when your lease expiration is 18 months out or headcount shifts more than 10%. |
Table of Contents
- How much office space per employee do you actually need?
- How to calculate your total rentable area
- How to divide the total space into zones and rooms
- How utilization and desk-sharing change your per-employee target
- Planning for growth and flexibility in your lease
- Worked examples and a quick-reference cheat sheet
- When to call a broker or space planner
- The density trap most planners fall into
- Frequently asked questions
- Sources
How much office space per employee do you actually need?
The commonly used planning baseline for usable area per employee varies depending on the density model you’re running, how many people show up on your busiest day, how much shared space your culture requires, and what the local building’s load factor adds on top.
The four density bands
High-density open plan. This is the call-center and trading-floor end of the spectrum. Rows of workstations, minimal private space, and shared amenities kept lean. Works when attendance is predictable and collaboration is task-based rather than creative. Circulation is tight, so HVAC and acoustic design carry more weight.

Standard hybrid office. A common target for knowledge-work companies running two-to-three days in-office schedules. Enough room for a mix of assigned and unassigned desks, a few small meeting rooms, and a break area that doesn’t feel punishing. Most office managers planning a new lease land here.
Low-density or private-office model. Law firms, financial advisory practices, and medical offices often operate with more space per person. Private offices, wider corridors, and dedicated conference rooms increase space needs. Culture and client-facing work justify the cost premium.
High-collaboration or creative workplace. Design studios, innovation labs, and headquarters spaces that function as cultural anchors rather than just workplaces. The additional square footage supports project rooms, maker spaces, lounge areas, and amenity investment. The office is the product here.
- Open-plan call center or operations with relatively low space per person
- Standard knowledge-work hybrid with moderate space allocation
- Professional services with private offices requiring more space
- Creative, collaborative, or HQ anchor spaces that allocate substantial space per person
Pro Tip: Don’t choose a density band based on what you can afford per square foot. Choose it based on your peak utilization rate and what your employees actually need to do their best work. A 90 sq ft target that drives people to work from home is more expensive than a 140 sq ft target with strong attendance.
How to calculate your total rentable area
Usable, rentable, and assignable: what the terms mean
These three terms are not interchangeable, and confusing them is the most common planning mistake.
Assignable area is the space you can actually put desks, chairs, and people in. It excludes internal walls, columns, and mechanical chases.
Usable area (also called Net Rentable Area in some markets) includes assignable space plus shared building amenities on your floor: corridors, restrooms, and janitor closets. This is the number your per-employee target is based on.
Rentable area is what your lease charges you for. It adds a proportionate share of common building areas, lobbies, and mechanical rooms through a factor called the load factor (sometimes called the add-on factor or common area factor). A typical load factor runs 1.10–1.25, meaning a space with 10,000 sq ft of usable area might rent as 11,000–12,500 sq ft.
| Term | What it includes | Typical use |
|---|---|---|
| Assignable area | Desks, offices, rooms only | Furniture planning |
| Usable area | Assignable + floor common areas | Per-employee target basis |
| Rentable area | Usable × load factor | Lease cost basis |
| Load factor | Rentable ÷ usable | Converts usable to leasable |
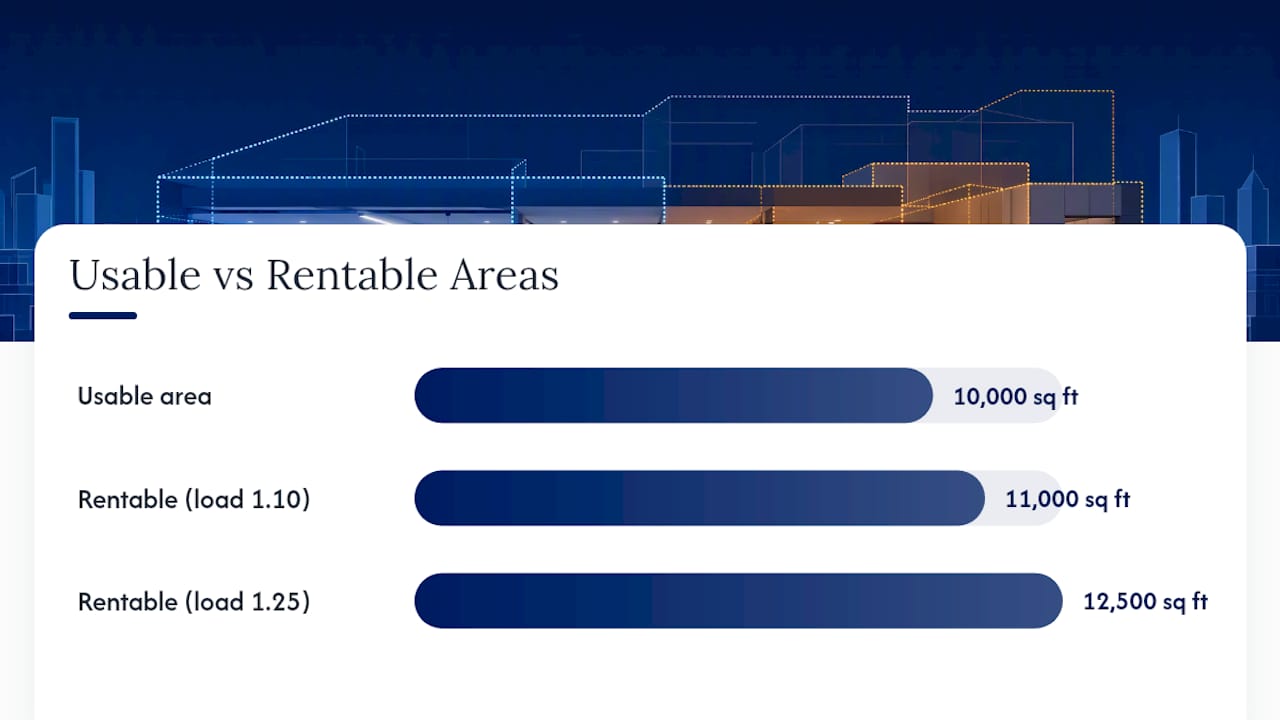
The core formula, step by step
Step 1. Determine your per-employee usable target (from the density bands above). Call it T.
Step 2. Estimate your peak daily headcount. For a hybrid team, this is not total headcount. It’s the number of people you expect on your busiest day, typically a Tuesday or Wednesday. Call it P.
Step 3. Apply a shared-area multiplier. Shared zones (meeting rooms, break rooms, reception, collaboration areas) typically add a moderate percentage on top of workstation area. Use 1.30 as a conservative starting point. Call it M.
Step 4. Divide by the usable-to-rentable ratio (the inverse of the load factor). For example, a typical load factor might be about 1.15.
Formula: Total Rentable Area = (T × P × M) ÷ (1 / Load Factor)
Or equivalently: Total Rentable Area = T × P × M × Load Factor
Worked example: 50-person hybrid team
- Workstation usable area: 120 × 33 = 3,960 sq ft
- With shared-area multiplier: 3,960 × 1.30 = 5,148 sq ft usable
- Rentable area: 5,148 × 1.15 = 5,920 sq ft
That’s the number to put in your search parameters. Round up to 6,000 sq ft to leave a small buffer.
Spreadsheet mini-calculator inputs:
- Cell A1: Per-employee target (sq ft)
- Cell A2: Total headcount
- Cell A3: Peak attendance rate (decimal, e.g., 0.65)
- Cell A4: Shared-area multiplier (e.g., 1.30)
- Cell A5: Load factor (e.g., 1.15)
- Formula cell: =A1*(A2*A3)A4A5
How to divide the total space into zones and rooms
Once you have a rentable target, the next job is breaking it into its parts. A common allocation for a standard hybrid office looks like this:
A few practical notes on how these zones interact. Small meeting rooms are the most chronically under-supplied element in office planning. A common rule of thumb is one small room per eight to ten workstations, but that ratio breaks down fast when hybrid schedules concentrate meetings on the same two days. Plan for more small rooms than you think you need, and fewer large ones.
Collaboration zones work best when they sit adjacent to meeting rooms rather than isolated in a corner. People move between focused work and group discussion throughout the day, and physical proximity reduces friction. Evidence-based spatial research on adjacency and interaction patterns consistently supports this layout logic.
- Place small meeting rooms within 30 feet of the densest workstation clusters.
- Put the break room on a path people naturally walk, not tucked behind a service corridor.
- Reserve 20–30% of gross floor area for circulation, structural elements, and mechanical access, even in open-plan layouts.
- Size reception for your peak visitor load, not your average day.
Human-centered design case studies from design institutions show that prototyping adjacency layouts with simple cardboard mock-ups before committing to a build-out catches problems that floor plans miss entirely.
How utilization and desk-sharing change your per-employee target
Static headcount is the wrong input for a hybrid office calculation. What matters is how many people show up, when, and how reliably you can predict it.
Utilization metrics worth tracking
Daily attendance rate is the simplest: total badge swipes divided by total headcount, averaged over 60–90 days. A rate of 0.55 means 55% of your team is in on any given day.
Peak-day occupancy is the number that actually determines whether you run out of desks. Track the highest single-day count over a rolling 30-day window. This is the P in your formula.
Average active users smooths out spikes and is useful for long-term planning, but it will underestimate your worst-day demand. Use it alongside peak-day data, not instead of it.
Desk-sharing ratios and their consequences
A 1:1 ratio means one desk per employee. A 0.8:1 ratio means 80 desks for 100 employees.
- 1:1 ratio: Safe for any attendance pattern; no desk anxiety; highest cost per person.
- 0.8:1 ratio: Works well when peak attendance is reliably below 80%; requires a booking system.
- 0.7:1 ratio: Appropriate for teams with 60–70% average attendance and strong data; needs a buffer of unbookable desks.
- 0.6:1 ratio: Only defensible with 90 days of badge-swipe data showing consistent sub-60% attendance.
Desk anxiety is real and its cost is indirect but measurable. When employees aren’t confident they’ll find a seat, attendance drops further, which looks like a utilization win but is actually a culture loss. The office stops functioning as a social anchor.
Data sources to collect before finalizing a ratio:
- Badge-swipe or access-control logs (minimum 60 days)
- Desk or room booking system exports
- Short pulse surveys asking employees about their intended in-office days
Pro Tip: Before cutting desks below a 0.8:1 ratio, run a 90-day pilot with a small buffer of unbookable “overflow” desks. Track whether attendance holds. If it does, you have the data to justify the reduction. If it drops, you’ve learned something important before signing a lease.
Corporate return-to-office mandates, like the four-day policy Disney implemented, can shift your peak-day assumption dramatically within a single quarter. Build that policy sensitivity into your scenario planning.
Planning for growth and flexibility in your lease
The biggest planning mistake isn’t getting the per-employee number wrong by 10 sq ft. It’s signing a 10-year lease for a space that fits today’s headcount with no room to move.
Lease levers
Expansion options give you the right to lease additional space in the building at a pre-negotiated rate. They’re worth fighting for in any lease over three years. Review the specific clauses carefully with a lease abstract before signing.
Break clauses let you exit early under defined conditions. They cost something in rent or tenant improvement allowance, but they’re cheap insurance against a headcount contraction.
Shorter initial terms (three to five years instead of seven to ten) reduce commitment risk. The trade-off is less landlord concession on tenant improvements and free rent.
Portfolio and operational levers
Satellite locations and flex or coworking credits let you absorb headcount spikes without committing to permanent square footage. Many companies now maintain a core lease for their regular team and a flex-space budget for project surges or new-market hires.
Hoteling and staggered schedules are operational levers that change your effective utilization without changing your lease. A team that staggers Monday/Wednesday and Tuesday/Thursday attendance can share a smaller footprint than one that all comes in on the same days.
Contingency checklist when headcount changes faster than expected:
- If headcount grows more than 15% in 12 months, activate your expansion option or begin a sublease search immediately.
- If headcount drops more than 10%, explore subletting excess space before your next renewal window.
- If utilization drops below 50% for 90 consecutive days, reassess your desk-sharing ratio and consider consolidating to a smaller floor.
- If a return-to-office mandate changes your peak-day assumption by more than 20%, rerun the formula before your next lease event.
People costs, salaries, benefits, and productivity losses from poor environments, dwarf real estate costs in any office budget. That’s the core logic behind the 3-30-300 heuristic that workplace planners often cite: the relative weight of utilities, rent, and people costs makes workspace decisions primarily a people decision, not a real estate one. Spend on the space that keeps your team productive and present.
Pro Tip: Present three scenarios to your leadership team before any lease decision: a low-occupancy case, a base case, and a high-occupancy case. Show the cost and cultural trade-offs for each. Decision-makers approve faster when they see the range, and you avoid rework when assumptions shift.
For portfolio-level location strategy, a data-driven site selection approach helps you weigh market conditions, commute patterns, and talent availability alongside pure square footage math.
Worked examples and a quick-reference cheat sheet
Example 1: 20-person team
- Workstation usable area: 130 × 16 = 2,080 sq ft
- With shared areas: 2,080 × 1.30 = 2,704 sq ft usable
- Rentable area: 2,704 × 1.15 = 3,110 sq ft
Example 2: 100-person team
- Workstation usable area: 120 × 70 = 8,400 sq ft
- With shared areas: 8,400 × 1.35 = 11,340 sq ft usable
- Rentable area: 11,340 × 1.15 = 13,041 sq ft
Example 3: 200-person team
- Workstation usable area: 110 × 130 = 14,300 sq ft
- With shared areas: 14,300 × 1.35 = 19,305 sq ft usable
- Rentable area: 19,305 × 1.18 = 22,780 sq ft
Quick-reference cheat sheet
| Team size | Per-person target | Peak headcount | Shared multiplier | Load factor | Rentable area |
|---|---|---|---|---|---|
| 20 people | 130 sq ft | 16 | 1.30 | 1.15 | ~3,110 sq ft |
| 100 people | 120 sq ft | 70 | 1.35 | 1.15 | ~13,041 sq ft |
| 200 people | 110 sq ft | 130 | 1.35 | 1.18 | ~22,780 sq ft |
Cost per employee: a quick estimate
To estimate annual cost per employee, take your total annual rent (rentable area × annual rent per sq ft) and divide by total headcount, not peak headcount. Add operating expenses, utilities, and janitorial costs, which typically run $8–$15 per sq ft annually in most U.S. markets, depending on building class and location. For a deeper look at how operating expenses stack up against loan sizing, the DSCR guide for commercial real estate walks through the math from a building-owner perspective that translates directly to tenant budgeting.
For a spreadsheet template, use the mini-calculator formula from Section 3 and add a cost row: =Rentable Area × Annual Rent per Sq Ft ÷ Total Headcount.
When to call a broker or space planner
Most office managers wait too long. By the time a space problem is obvious, the best options in the market are gone. Here are the signals that mean it’s time to pick up the phone.
Trigger events:
- Lease expiration within 18 months
- Expected headcount change of more than 10% in either direction
- Utilization data showing consistent over- or under-occupancy for 90+ days
- A return-to-office policy change that shifts your peak-day assumption
- A merger, acquisition, or restructuring that changes your footprint requirements
Pre-meeting checklist for your first broker conversation:
- Current rentable area and lease expiration date
- Total headcount and expected headcount in 12, 24, and 36 months
- Peak daily attendance data (badge swipes or booking logs, 60–90 days)
- Current per-employee usable area (calculate it: usable area ÷ headcount)
- Budget range: target annual rent per sq ft and total annual occupancy cost
- Must-have amenities (parking, loading, server room, accessibility requirements)
- Preferred submarkets or commute-zone constraints
- Lease flexibility requirements (expansion option, break clause, term preference)
A commercial broker brings market analysis, comparable lease data, and negotiation leverage that an office manager working alone simply can’t replicate. They’ll also coordinate with space planners and architects to validate that a shortlisted building can actually be configured to meet your layout requirements. For Charlotte-area market conditions and submarket data, Ardorcre’s office market analysis is a useful starting point before your first broker meeting.
Pro Tip: Bring three scenario outputs to your broker meeting: low, base, and high occupancy. Brokers can search more efficiently when they understand your range, and you’ll get better options than if you give a single fixed number.
When you’re ready to engage, Ardorcre’s commercial advisory team handles tenant representation, lease negotiation, and space planning coordination across the Charlotte MSA. For broker network resources and expanded search support, Brokers Connect is a useful partner network to know.
HUD accessibility guidance affects minimum clearances, restroom ratios, and accessible route requirements that your broker and architect need to account for in any layout review. Confirm compliance requirements before finalizing a floor plan.
The density trap most planners fall into
The conventional wisdom says: cut square footage, cut cost. Run the numbers, find the lowest defensible per-person target, and sign the smallest lease you can justify. It’s a logical instinct and it’s usually wrong.
Here’s what that logic misses. The office isn’t just a cost center. For a hybrid team, it’s the primary reason people make the commute. If the space is too dense, too loud, or too short on meeting rooms, attendance drops. And when attendance drops, the utilization data looks great on paper while the culture quietly erodes. You’ve optimized the real estate and degraded the team.
The smarter frame is to design for peak demand and social value. Ask what the office needs to deliver on your two busiest days of the week, not what the average day looks like. Then ask whether the space gives people a genuine reason to be there: good light, decent acoustics, rooms they can actually book, and a kitchen that doesn’t feel like an afterthought. Spatial research on daylighting and ergonomics consistently links these physical conditions to both attendance and output quality.
The practical recommendation: start at 120–140 sq ft per person for a standard hybrid office, collect 90 days of utilization data, and then adjust. Don’t go below 100 sq ft without peak-day data that clearly supports it. And don’t let a tight budget drive you to a density that makes the office a place people avoid. The cost of low attendance is harder to see on a spreadsheet than the cost of square footage, but it’s real and it compounds. Human-centered design prototyping methods offer a practical way to test layout assumptions before committing to a build-out.
Frequently asked questions
What is the standard office space per employee?
The most widely used planning range is 100–150 sq ft of usable area per employee for a standard hybrid knowledge-work office. High-density operations run as low as 75–100 sq ft; private-office models run 150–250 sq ft.
How do I calculate total office space needed?
Multiply your per-employee usable target by your peak daily headcount, then by a shared-area multiplier (typically 1.25–1.40), then by your building’s load factor (typically 1.10–1.25). The result is your total rentable area.
How does hybrid work change my space requirements?
Hybrid work means your planning basis is peak-day attendance, not total headcount. That changes your rentable area target significantly.
What is a load factor and why does it matter?
The load factor (also called the add-on factor) is the ratio of rentable area to usable area. Always ask for the load factor before comparing two buildings on rent per sq ft.
How many square feet does a conference room need?
Small meeting rooms for two to four people typically run 100–150 sq ft. Medium rooms for six to eight people run 200–300 sq ft. Large conference rooms for ten to sixteen people run 350–500 sq ft.
When should I hire a commercial broker?
What accessibility requirements affect office space planning?
Federal guidance from HUD and the Americans with Disabilities Act sets minimum clearances for accessible routes, restroom configurations, and door widths that reduce your assignable area. Confirm these requirements with your architect and broker before finalizing any floor plan.