
Cash-on-cash return (CoC) measures exactly one thing: how much annual pre-tax cash you pocket relative to the cash you put in. The formula is simple:
CoC = Annual Before-Tax Cash Flow ÷ Total Cash Invested
Think of it as a quick screening metric — a napkin test you run on a deal before committing hours to a full underwriting model. It tells you whether a property’s cash yield clears your minimum threshold. What it won’t tell you is how the deal performs over a 10-year hold, what appreciation does to your equity, or how taxes reshape your actual return. Use CoC to screen in or screen out, then pair it with IRR and ROI before you sign anything.
- What it measures: Annual cash yield on deployed capital, single-year snapshot
- Formula: Annual Before-Tax Cash Flow ÷ Total Cash Invested
- Best use: Fast deal screening before deeper underwriting
- Key limit: Ignores appreciation, principal paydown, and tax effects
Key Takeaways
Cash-on-cash return is a reliable first filter for real estate deals, but it requires accurate inputs and must be paired with IRR and lease-level review before any capital commitment.
| Point | Details |
|---|---|
| The formula | CoC = Annual Before-Tax Cash Flow ÷ Total Cash Invested, expressed as a percentage. |
| Best use case | Screen deals quickly; a CoC below your minimum threshold ends the analysis early. |
| Target range | 8–12% is generally strong; above 15% warrants a hard look at leverage and risk. |
| Key limitation | CoC ignores appreciation, principal paydown, and taxes — always follow up with an IRR model. |
| Ardorcre’s role | Ardorcre advisors verify CoC inputs, review leases, and run DSCR analysis for Charlotte MSA investors. |
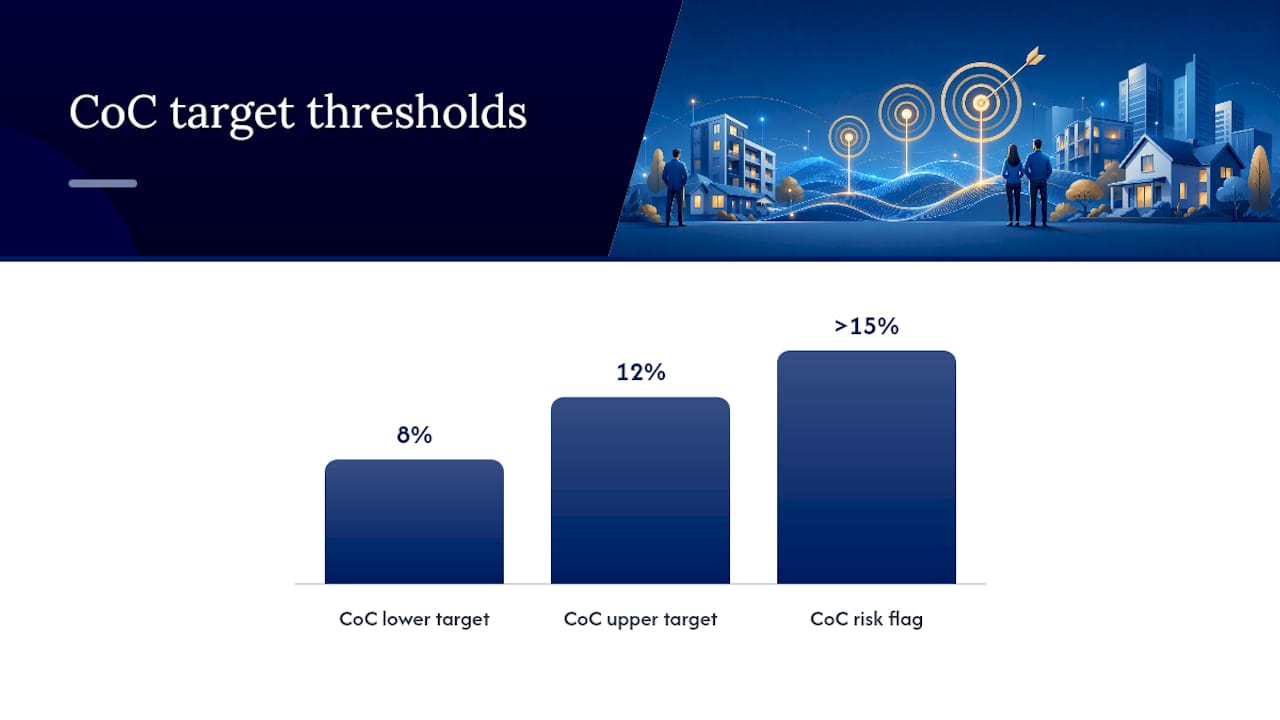
Table of Contents
- How to calculate cash on cash return
- What actually goes into each input
- How CoC compares to cap rate, ROI, and IRR
- What counts as a good cash on cash return?
- Why CoC can mislead you
- Using CoC in your underwriting process
- An advisor’s perspective on CoC in practice
- Ardorcre can verify your inputs and run the deeper analysis
- Sources
How to calculate cash on cash return
The math is straightforward. Getting the inputs right is where most investors slip up.
Step-by-step
- Determine gross annual rent — use actual signed leases or conservative market comps, not asking rents.
- Subtract vacancy allowance — typically 5–10% of gross rent for stabilized assets; more for value-add.
- Subtract annual operating expenses — property taxes, insurance, management fees, maintenance, and utilities you cover. Use the property management budget as a line-item reference.
- Subtract annual debt service — total principal and interest payments for the year (zero if all-cash).
- The result is your Annual Before-Tax Cash Flow.
- Sum your total cash invested — down payment, closing costs, immediate rehab, and funded reserves.
- Divide cash flow by total cash invested. Multiply by 100 for a percentage.
Per CalcFi’s calculator logic, the conversion from monthly inputs is: Annual Cash Flow = (Gross Rent − Vacancy − Operating Expenses − Monthly Debt Service) × 12.
Worked example A: all-cash purchase
| Line Item | Amount |
|---|---|
| Gross annual rent | $120,000 |
| Vacancy (8%) | ($9,600) |
| Operating expenses | ($30,000) |
| Annual debt service | $0 |
| Annual Before-Tax Cash Flow | $80,400 |
| Purchase price (total cash invested) | $900,000 |
| CoC | 8.9% |
Worked example B: financed purchase
Same property, but you put $300,000 down and carry a mortgage with $24,000 in annual debt service. The NOI stays at $80,400 before debt.
| Line Item | Amount |
|---|---|
| Annual NOI (before debt) | $80,400 |
| Annual debt service | ($24,000) |
| Annual Before-Tax Cash Flow | $56,400 |
| Total cash invested (down + closing) | $300,000 |
| CoC | 18.8% |
Leverage nearly doubled the CoC percentage here. That’s the mechanical effect of using other people’s money — and also why a high CoC on a heavily financed deal deserves scrutiny rather than celebration. Wikipedia’s worked examples illustrate the same dynamic: $60,000 NOI with $24,000 in annual mortgage payments on $300,000 cash invested produces a 12% CoC ($36,000 ÷ $300,000).
Pro Tip: *Round monthly rent and expense figures to the nearest $50 before annualizing.
What actually goes into each input
Garbage in, garbage out. The two most common ways investors inflate CoC are understating total cash invested and overstating annual cash flow.
Total cash invested — include all of these
- Down payment (or full purchase price if all-cash)
- Closing costs: title, escrow, lender fees, transfer taxes
- Immediate capital improvements or rehab costs before the property stabilizes
- Funded reserves deposited at closing (replacement reserve accounts)
- Acquisition fees paid to brokers or syndicators
Annual before-tax cash flow — what belongs
- Gross scheduled rent (from signed lease terms, not projections)
- Less: vacancy and credit loss allowance
- Less: all operating expenses (taxes, insurance, management, maintenance, utilities)
- Less: annual debt service (principal + interest)
Common gotchas
- Omitted capital expenditure reserves. Roof, HVAC, and parking lot replacements are not operating expenses, but they consume cash. Exclude them from annual cash flow and you’ll overstate CoC every year until the bill arrives.
- Seller credits treated as income. A seller credit at closing reduces your out-of-pocket cost, which is fine to net against total cash invested — but it is not recurring income.
- Return-of-capital items. Security deposits and tenant improvement allowances are not revenue.
- Deferred maintenance. A property with deferred maintenance often shows clean operating expenses right up until it doesn’t.
Pro Tip: BiggerPockets recommends building conservative assumptions into every input. If you’re unsure about a vacancy rate, use the higher end of the range. A CoC that still clears your threshold under pessimistic assumptions is a deal worth pursuing.
How CoC compares to cap rate, ROI, and IRR
Each metric answers a different question. Using the wrong one for your question is a common and costly mistake.
| Metric | Definition | Financing | Time Horizon | Best Use Case |
|---|---|---|---|---|
| Cash-on-Cash Return | Annual pre-tax cash flow ÷ cash invested | Includes debt service | Single year | Quick deal screening; comparing financing structures |
| Cap Rate | NOI ÷ property value | Ignores financing | Single year | Comparing properties on a level playing field |
| ROI | Total return ÷ total cost | Can include or exclude | Multi-year | Measuring total profit including sale proceeds |
| IRR | Discount rate that zeroes NPV of all cash flows | Includes all cash flows | Multi-year | Full hold-period performance; comparing across deals |
A few practical notes worth keeping in mind:
- Cap rate equals CoC when you buy all-cash. With no debt service, the only difference is the denominator: cap rate uses property value, CoC uses cash invested. On an all-cash deal, those are the same number.
- Use CoC when comparing two financing structures on the same property. It directly shows how leverage changes your annual yield.
- Switch to IRR when the hold period matters. A deal with a modest CoC but strong appreciation and principal paydown can outperform a high-CoC deal over a 7–10 year hold. IRR captures that; CoC never will.
- ROI works best post-sale, when you can measure actual total return including the exit.
For a deeper read on how value ratings integrate these signals, Oracle Investments’ value-rating guide walks through a practical multi-metric framework.
What counts as a good cash on cash return?
Context matters more than the number itself, but here are the ranges practitioners actually use.
- Below 5%: Generally too thin for a cash-flow-focused strategy. May be acceptable for a trophy asset in a high-appreciation market where the investor is betting on equity growth, not yield.
- 6–8%: Acceptable for stabilized commercial assets in primary markets with strong tenants and long lease terms.
- 8–12%: The range CalcFi and most practitioner guides identify as generally strong for rental properties. Clears most investors’ minimum hurdle while reflecting realistic risk.
- Above 15%: Worth a hard look at why. Elevated CoC often signals aggressive leverage, deferred maintenance, a short remaining lease term, or distressed pricing.
Is 10% good?
Yes, for most strategies. In a low-interest-rate environment it would be exceptional; in a higher-rate environment it may be the minimum that justifies illiquidity.
Is 20% good?
Conditionally. Chase’s commercial lending team flags that very high CoC percentages frequently signal elevated risk rather than a free lunch. Is there deferred maintenance? Is the income from a single tenant with a short lease? If you can’t answer those cleanly, the number is a warning sign, not a win.
Red flags that inflate CoC:
- Loan-to-value above typical industry thresholds on a value-add asset
- One-time income (lease termination fees, insurance proceeds) counted as recurring rent
- Operating expenses that exclude management fees because the owner self-manages
- No vacancy allowance on a property that has never been fully occupied
Why CoC can mislead you
CoC is a single-year, pre-tax snapshot. That’s its strength for screening and its weakness for decision-making.
What it ignores: appreciation, principal paydown, depreciation tax shields, and the time value of money. IRR captures the full picture; CoC sees only year one.
False positives to watch for. Return-of-capital items misclassified as income push cash flow up artificially. Capital expenditures excluded from operating expenses do the same. A property with a new roof, fresh HVAC, and a long-term lease will show a clean CoC; the same property five years later, with aging systems and no reserves, will show the same CoC right up until a $90,000 capital call hits.
Leverage distortion. Increasing your loan-to-value ratio mechanically raises CoC by reducing the denominator. That’s not a better deal — it’s more risk.
Pro Tip: Before relying on a CoC figure, stress-test it. If CoC still clears your threshold, the deal has real margin. If it doesn’t, you’ve found the risk the seller’s pro forma buried.
Using CoC in your underwriting process
CoC earns its keep as a first filter, not a final answer. Here’s how to run it systematically.
Screening checklist:
- Pull gross rent from signed leases or verified market comps, not the listing sheet.
- Apply a vacancy rate consistent with the submarket’s trailing 12-month data.
- Use actual operating expense history (T-12 financials), not the seller’s projections.
- Include a replacement reserve line: typically $0.15–$0.25 per square foot annually for commercial assets.
- Confirm total cash invested includes all closing costs and any funded reserves.
- Calculate CoC. If it clears your minimum threshold, proceed. If not, stop.
When CoC looks attractive, run these next:
- DSCR check. Confirm the property’s net operating income covers debt service at your lender’s required ratio. A DSCR analysis will also tell you how much loan the property can support, which affects your total cash invested figure.
- IRR model. Build a 5–10 year hold model with realistic exit assumptions. CoC may look strong in year one but deteriorate if rents are flat and expenses escalate.
- Lease review. Pull the actual lease documents. Verify rent escalation clauses, expense pass-throughs (especially relevant for triple net structures), and any co-tenancy or termination provisions that could interrupt cash flow.
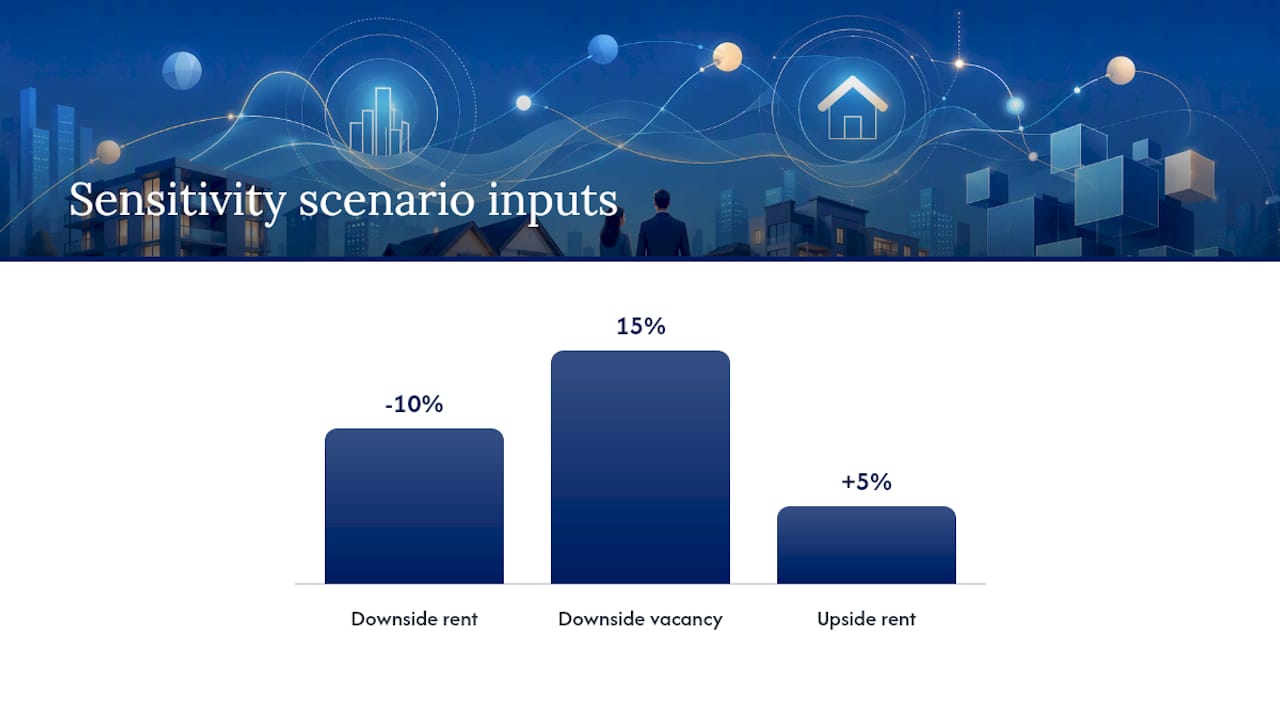
- Sensitivity analysis. Test CoC and IRR under three scenarios: base, downside (10% rent reduction, 15% vacancy), and upside (5% rent growth, full occupancy).
- Capex reserve audit. Review the property’s capital expenditure history and age of major systems. Budget accordingly before finalizing your cash flow assumptions.
For multifamily assets, Locker Solutions’ apartment ROI guide covers operational levers that directly affect the cash flow inputs you’ll use in this process.
When to involve an advisor: If the lease structure is complex, the rent roll has near-term rollover risk, or you’re comparing multiple assets in an unfamiliar submarket, bring in a commercial advisor before finalizing your underwriting assumptions. A single misread lease clause can shift CoC by several percentage points.
An advisor’s perspective on CoC in practice
CoC is the metric I reach for first on every deal, and the one I trust least by itself. It answers the question every investor actually asks in the first 60 seconds: “Does this thing pay me enough to bother?” That’s a legitimate question, and CoC answers it cleanly. The problem is when investors stop there.
The deals I’ve seen go sideways weren’t underwritten with bad CoC numbers. They were underwritten with good CoC numbers and nothing else. Every one of those outcomes was visible in the lease documents and the capital expenditure history — neither of which CoC touches.
In the Charlotte MSA, where Ardorcre works across office, medical, retail, and industrial assets, the spread between a seller’s projected CoC and a verified CoC after lease review and expense normalization is often 2–4 percentage points. That gap is where advisory work earns its keep. Run CoC as your filter. Then run IRR, review the leases, and stress-test your vacancy assumptions before you commit capital.
Ardorcre can verify your inputs and run the deeper analysis
If a deal’s cash-on-cash return clears your threshold and you’re ready to go deeper, Ardorcre’s advisory team works with commercial investors across the Charlotte MSA to validate the inputs that matter most: lease-level rent verification, operating expense normalization, and market comp analysis to confirm your vacancy assumptions are grounded in real submarket data.

Ardorcre advisors also run DSCR sizing to confirm your financing structure holds up under lender scrutiny, and review lease abstracts to surface rent escalations, expense obligations, and termination clauses that directly affect your annual cash flow figure. For office, medical, retail, and industrial assets in the Charlotte market, that ground-level lease and market knowledge is what separates a confident underwrite from a spreadsheet guess. Reach out to Ardorcre to schedule a deal review before you move to LOI.
Sources
- Cash-on-Cash Return: Real Estate Investment Guide & Formula
- Cash-on-Cash Return Calculator — Real ROI | CalcFi
- What Is Cash-On-Cash Return & How To Calculate It
- Cash on cash return
This article is general information, not a substitute for advice from a qualified financial advisor. Consult a qualified financial professional about your own circumstances before acting on anything here.