
The best retail sites satisfy a short, measurable set of criteria: sufficient trade-area demand within a realistic drive-time catchment, traffic that converts (not just passes), a strong demographic match to your customer profile, manageable competitive density, and site economics where projected rent-to-sales stays below your concept’s threshold. Run those five filters through a weighted scoring model, back-test the weights against your top-performing stores, and you get a defensible shortlist rather than a gut-feel guess. Quick verdict: sites that clear all five filters are green and proceed to full underwriting; sites with one weak factor are amber and need deeper analysis; sites with two or more weak factors are a pass. Location intelligence that combines hyperlocal market data with mapping converts this from educated guesswork into a repeatable process you can benchmark against actual store performance.
At a glance, check these five metrics first:
- Primary trade-area population within your concept’s drive-time threshold (QSR: 3–5 min; grocery: 5–10 min; specialty: 10–15 min)
- Weekday vs. weekend footfall split and daypart concentration from a mobility platform like Placer.ai
- Target-customer percentile match (income, age, household composition) scored against your existing top stores
- Competitive density: direct competitor count within the primary trade area
- Rent-to-projected-sales ratio benchmarked against your concept’s acceptable ceiling (typically 8–12% for most retail formats)
Key Takeaways
Retail site selection succeeds when trade-area demand, customer match, site economics, and physical fit are each scored against concept-specific thresholds in a back-tested, weighted model.
| Point | Details |
|---|---|
| Use drive-time isochrones | Primary trade areas supply 50–80% of revenue; drive-time polygons outperform radius buffers for realistic catchment sizing. |
| Validate traffic quality | Daypart and trip-purpose data from Placer.ai or SafeGraph reveal whether counts convert to sales. |
| Model all three scenarios | Conservative, expected, and optimistic underwriting; a site that fails the conservative case is a pass. |
| Back-test scoring weights | Calibrate model weights against your top-performing stores before applying them to new candidates. |
| Ardorcre covers the full process | Ardorcre’s advisors run market screening, trade-area modeling, underwriting, and lease negotiation for retail tenants in the Charlotte MSA. |
Table of Contents
- What are the core retail site selection criteria to measure?
- Which data tools and sources should you use for site analysis?
- How do you build the financial model for a retail site?
- How do you score and compare candidate retail sites?
- A step-by-step playbook with a worked example
- What mistakes and red flags should you watch for?
- What does the selection-to-open timeline and cost look like?
- What does the timeline and cost look like for opening a retail store?
- How do you benchmark performance after opening?
- How do you manage risk factors in retail site selection?
- What legal considerations go beyond zoning and permits?
- How does community and stakeholder engagement affect site success?
- How does omnichannel strategy affect retail site selection?
- Why the conventional wisdom on site selection is still wrong
- Ardorcre brings the full playbook to your site search
- Sources
What are the core retail site selection criteria to measure?
Retail site selection criteria fall into eight measurable categories. Each one has a specific data source and a threshold you can define before you ever visit a property.
Trade-area definition
The trade area is the geography from which a store draws the majority of its customers. Drive-time isochrones outperform simple radius buffers because they account for actual roads, barriers, and traffic patterns. Primary trade areas typically supply a large majority of a store’s revenue depending on concept type. A 3-mile radius drawn around a site in a grid-street suburb and the same radius in a dense urban core with a river bisecting it represent completely different customer pools. Use drive-time polygons, not circles.
Standard thresholds by concept type:
| Concept | Primary trade area | Secondary trade area |
|---|---|---|
| Quick-service restaurant | 3–5 min drive | 5–10 min drive |
| Grocery / supermarket | 5–10 min drive | 10–15 min drive |
| Specialty retail | 10–15 min drive | 15–20 min drive |
| Big-box / destination | 15–20 min drive | 20–30 min drive |
For walkable urban locations, substitute walk-time isochrones (5–10 min walk for QSR; 10–15 min for specialty). Transit-oriented sites need a separate transit-shed overlay.
Pro Tip: Run both a drive-time isochrone and a visitation-based trade area from Placer.ai or SafeGraph for the same site. Where they diverge significantly, the visitation polygon is closer to reality. The gap usually signals a barrier (a highway, a river, a dead-end street pattern) your drive-time model missed.
Demand and foot-traffic metrics
Raw traffic counts mislead more often than they inform. Trip purpose and daypart patterns determine whether counts convert to visits that matter for sales, so validate traffic against localized performance data rather than accepting AADT figures at face value.
Metrics to pull from a mobility platform:
- Monthly unique visitors and total visits (trailing 90 days minimum)
- Visit growth trend (quarter-over-quarter, year-over-year)
- Daypart split: morning, midday, evening, weekend
- Median dwell time (a proxy for engagement vs. pass-through)
- Origin ZIP codes (confirms whether the trade area you drew matches where customers actually come from)
Customer match
Demographic alignment is the difference between a site with traffic and a site with your traffic. Map the trade-area population against your concept’s target profile: household income, age distribution, household size, and lifestyle/psychographic segment. Score each candidate site on a percentile basis relative to your existing store portfolio. A site that ranks in the 80th percentile for income match but the 30th percentile for household density may still underperform a site that ranks 65th on both.
Spending-per-capita data from card-transaction datasets (available through providers like CoStar’s analytics layer or third-party spend aggregators) converts raw population into realistic sales potential. A trade area with 50,000 residents spending $180 per capita annually in your category gives you a total addressable market to penetrate, not just a headcount.
Competition and co-tenancy
Count direct competitors within the primary trade area and map their locations relative to your proposed site. Then assess co-tenancy: anchor tenants and complementary retailers that generate traffic you can capture. A fitness studio next to a healthy-food concept is a co-tenancy benefit; a dollar store next to a premium specialty retailer is a brand-environment mismatch.
For multi-unit operators, overlay trade areas to quantify cannibalization before committing. Overlapping catchments dilute revenue at both locations. A significant shared-customer overlap typically warrants a formal cannibalization model before proceeding.
Accessibility and visibility
Accessibility covers everything a customer must navigate to reach your door: ingress/egress points, traffic signal placement, U-turn availability, parking ratio (spaces per 1,000 sq ft), and proximity to transit stops. Visibility covers sightlines from the primary approach road, signage allowance, and whether the building reads clearly at 35 mph.
Drive the site at your concept’s peak hours. A site that looks accessible on a map may have a left-turn restriction during evening rush that effectively cuts off half the trade area.
Site economics
The rent-to-sales ratio is the single most important financial metric in retail site selection. Effective rent (base rent adjusted for tenant improvement allowances, free-rent periods, and landlord concessions) can differ substantially from the headline figure on a listing.
Operating expense structure matters equally. A triple-net lease shifts property taxes, insurance, and maintenance to the tenant. Know the full occupancy cost before modeling.
Zoning, permitting, and use restrictions
Confirm the zoning designation allows your use before spending time on financial modeling. Check for conditional use permits, hours-of-operation restrictions, drive-through prohibitions, and signage limits. Review the lease for exclusivity clauses (protecting you from a competing tenant in the same center) and co-tenancy clauses (allowing rent reduction or termination if an anchor leaves). These provisions can make or break a site’s economics. A thorough lease abstract surfaces these terms before you’re committed.
Building and site fit
Measure the usable footprint against your prototype requirements. Assess ceiling height, column spacing, utility capacity (electrical, HVAC, plumbing), loading access, and service-area configuration. ADA compliance is non-negotiable: confirm accessible parking, path-of-travel, entrance width, and restroom compliance under the Americans with Disabilities Act. Signage allowance in the lease must match what your brand requires for visibility.
Which data tools and sources should you use for site analysis?
A defensible site evaluation draws from multiple data layers. No single platform covers everything, and the combination of sources is what separates a rigorous analysis from a spreadsheet built on assumptions.
- Placer.ai: — Mobility and foot-traffic platform that provides visit volumes, unique visitor counts, origin-destination analysis, daypart breakdowns, and cross-shopping patterns. Use it to validate trade-area assumptions and compare candidate sites on a common traffic metric.
- LoopNet: CoStar’s consumer-facing listing platform. Useful for initial property identification and for understanding what is actively marketed in a target submarket. See the Crexi vs. LoopNet comparison for a detailed breakdown of how these platforms differ in practice.
Combining mobility, demographics, competition, and accessibility in a single model improves demand forecasting and allows teams to identify high-potential markets before committing to site-level analysis.
How do you build the financial model for a retail site?
Converting location data into a go/no-go financial decision requires a structured underwriting model. The core formula is straightforward; the discipline is in the inputs.
Core formulas:
- Projected annual sales: Trade-area households × penetration rate × visit frequency × average transaction value
- Rent-to-sales ratio: Annual base rent ÷ projected annual sales
- Effective rent: (Annual base rent × lease term) minus TI allowance minus free-rent value, annualized
- Break-even sales per sq ft: Total annual occupancy cost ÷ net leasable area
- Contribution margin: (Sales per sq ft × gross margin %) minus occupancy cost per sq ft
- DSCR implication: If the site is owner-occupied or part of a financed portfolio, net operating income must cover debt service; see Ardorcre’s DSCR guide for commercial real estate for loan-sizing context.
Sample underwriting scenarios (2,500 sq ft specialty retail):
Only the optimistic scenario clears the threshold, and optimistic scenarios should never anchor a go decision.
Critical sensitivity variables to stress-test:
- Conversion rate (what share of trade-area households actually visit)
- Average ticket (test at 15% below your current store average)
- Weekday/weekend split (a site that depends on weekend traffic is more vulnerable to weather and competition)
- Cannibalization percentage (for networks with nearby locations)
- TI burn-down (how long before effective rent equals base rent)
How do you score and compare candidate retail sites?
A scoring model turns subjective site comparisons into a documented, repeatable ranking. A multi-layered screening approach reduces forecasting uncertainty when layers are weighted according to what actually predicts performance for your concept.
Scoring model architecture
Normalize every metric to a 0–100 percentile score relative to your candidate pool or your existing store portfolio. This makes a foot-traffic count comparable to a demographic index without forcing you to convert apples to oranges.
Recommended categories and example weight ranges:
| Category | Example weight range | Key metrics |
|---|---|---|
| Traffic and demand | 25–35% | Visit volume, growth trend, daypart fit |
| Customer match | 20–30% | Income percentile, age fit, spend per capita |
| Competition | 10–20% | Direct competitor count, co-tenancy quality |
| Site economics | 20–30% | Rent-to-sales ratio, effective rent, TI |
| Physical fit | 10–15% | Footprint, parking, visibility, ADA |
| Legal and entitlements | 5–10% | Zoning, exclusives, permitting timeline |
Back-test these weights against your top-performing stores before finalizing them. Adjust until the model’s rankings correlate with actual store performance.
Shortlisting checklist
Every candidate site that advances past initial screening should have these documents attached before a final scoring review:
- Isochrone map (drive-time polygons for primary, secondary, and tertiary zones)
- Foot-traffic snapshot (trailing 90-day visit trend from Placer.ai or equivalent)
- Rent schedule with TI allowance and free-rent terms
- Local zoning extract confirming permitted use
- Site photos (exterior approach, parking, signage position, adjacent tenants)
- Competitive density map (direct competitors within primary trade area)
Set a minimum composite score threshold based on your risk appetite. A portfolio with strong existing stores and a proven prototype can afford a higher threshold (e.g., 70/100 minimum). A first-location operator with no back-test data should be more conservative and use the scoring model as a comparison tool rather than an absolute gate.
A step-by-step playbook with a worked example
A rigorous site-selection workflow integrates market screening, trade-area modeling, scoring, underwriting, negotiation, and post-opening validation to reduce expansion risk. Here is how that sequence works in practice.
The seven-step playbook:
- Step 1: Define the mandate. Set the prototype requirements (sq ft range, parking minimum, co-tenancy preferences, rent ceiling) and the target market geography before touching any data.
- Step 2: Market screen. Use Esri or a mobility platform to rank submarkets by trade-area population, income index, and category spend per capita. Eliminate markets that fail minimum thresholds.
- Step 3: Site identification. Pull active listings from CoStar and LoopNet. Layer broker relationships for off-market opportunities. Generate a long list of 10–20 candidates.
- Step 4: Score and shortlist. Apply the weighted scoring model to the long list. Advance the top 3–5 sites to full underwriting.
- Step 5: Underwrite. Build the three-scenario financial model for each shortlisted site. Confirm effective rent, TI, and operating expense structure with the landlord or listing broker.
- Step 6: Negotiate. Use the underwriting model to anchor rent negotiations. A site where the expected scenario produces a 14% rent-to-sales ratio has room to negotiate; a site at 9% does not need the same pressure.
- Step 7: Post-opening benchmarking. Compare actual monthly sales, visit counts, and customer origin patterns against the projections from Step 5. Recalibrate the scoring model weights if the gap is material.
Worked example: Charlotte MSA specialty retail
An Ardorcre client evaluating a 2,200 sq ft specialty retail site in a Charlotte-area mixed-use development ran the full playbook. Placer.ai data showed the adjacent anchor (a regional grocery chain) generating strong weekday evening traffic, a daypart that aligned with the client’s peak sales window. The initial scoring model ranked the site 74/100.
The landlord offered a $45,000 TI allowance against a 5-year lease, which reduced effective rent in years 1–2 and improved the break-even timeline.
What shifted the decision from amber to green was the co-tenancy analysis. The grocery anchor’s evening traffic pattern was not visible in the raw AADT count for the road. It only appeared in the Placer.ai daypart breakdown.
Pro Tip: During the site visit, check sightlines from the primary approach direction at the speed limit, not at walking pace. A sign that reads clearly on foot may be completely obscured by a utility pole or a neighboring tenant’s canopy at 35 mph. Sightline obstructions are a site-visit finding; visitation origin patterns require data.
A site that scores well on demographics but poorly on daypart alignment is not a good site for your concept. It is a good site for someone else’s concept. The data tells you which one you are.
What mistakes and red flags should you watch for?
Most bad retail openings trace back to a small set of analytical errors. Recognizing them early is cheaper than correcting them after signing a 10-year lease.
Common analytical mistakes:
- Relying on raw traffic counts without trip-purpose analysis. A high AADT number on a commuter arterial does not translate to stop-in customers. Always pull daypart and origin-destination data before treating a traffic count as a demand signal.
- Using radius buffers instead of drive-time isochrones. A 3-mile radius in a suburban grid looks similar to one in a fragmented street network, but the actual accessible population can differ by 40% or more. Drive-time isochrones and visitation-based trade areas outperform concentric circles for any site where road network complexity matters.
- Ignoring cannibalization for multi-unit networks. Opening a second location 1.5 miles from an existing store without modeling trade-area overlap is one of the most common portfolio mistakes. Overlapping catchments dilute revenue at both locations.
- Accepting headline rent without modeling effective rent. TI allowances, free-rent periods, and landlord concessions can reduce effective rent by 15–25% in the first lease term. Negotiate and model these before comparing sites on base rent alone.
- Not stress-testing the downside scenario. An expected-case model that barely clears the rent-to-sales threshold fails in the first year if conversion runs 20% below forecast. Always model a conservative case and confirm the business survives it.
Red flags to catch on a site visit:
- Poor sightlines from the primary approach direction (obscured by landscaping, a neighboring sign, or a building setback)
- Constrained ingress/egress (single entry point, no left-turn access, shared driveway conflicts)
- Parking ratio below your concept’s minimum (typically 4–5 spaces per 1,000 sq ft for most retail)
- Tenant mix mismatch (adjacent tenants that attract a demographic inconsistent with your customer profile)
- Deferred maintenance on the building or parking lot (signals a landlord who may not fund TI adequately)
- Vacant anchor space in the same center with no signed replacement tenant
Why commercial property buyers focus on location as the primary value driver applies equally to retail tenants: a site’s physical and competitive context is the one thing a lease cannot change.
What does the selection-to-open timeline and cost look like?
Retail site selection and buildout take longer and cost more than most first-time operators expect. Here is a realistic sequence with time ranges.
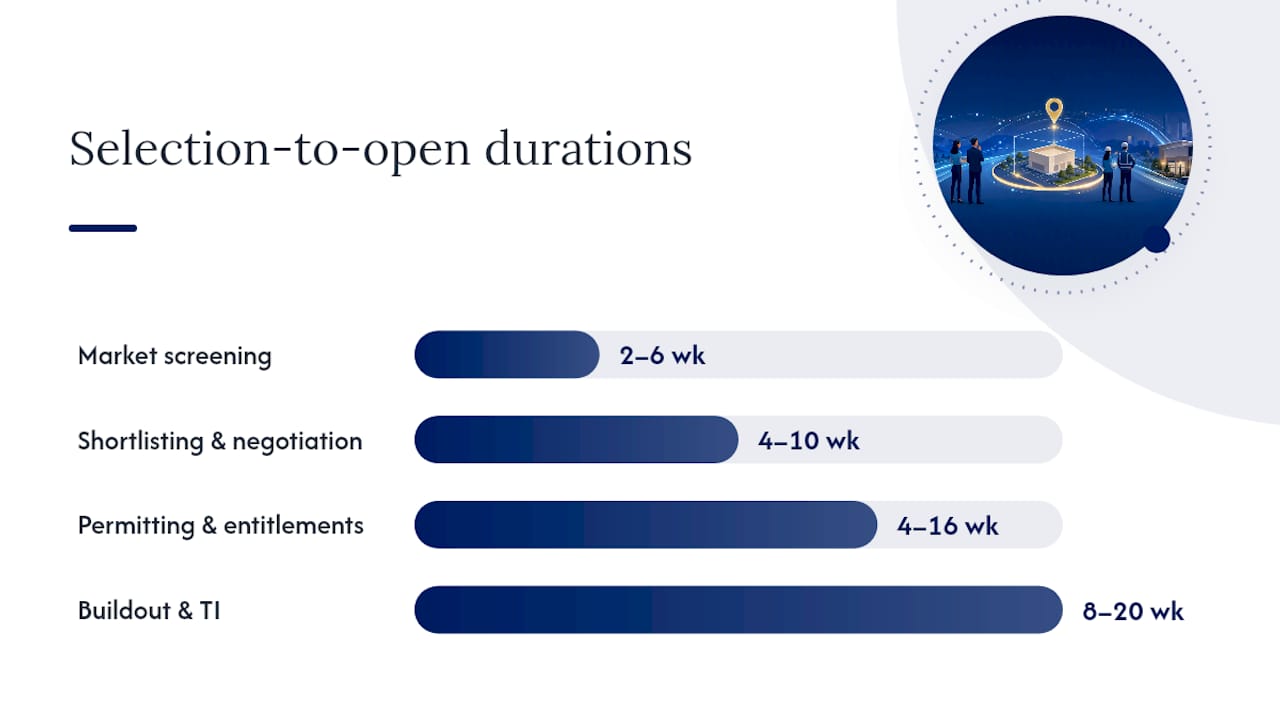
- Market screening and site identification (2–6 weeks). Pulling and ranking candidate markets, generating a long list of properties, and completing initial scoring. Cost: data subscriptions ($500–$2,500/month for platforms like Placer.ai or Esri Business Analyst) plus broker time (typically covered by commission at lease signing).
- Shortlisting, underwriting, and negotiation (4–10 weeks). Full financial modeling for 3–5 sites, landlord negotiations, and lease review. Cost: legal review ($1,500–$5,000 for lease counsel); architectural space-planning ($2,000–$8,000 for a test-fit drawing).
- Permitting and entitlements (4–16 weeks). Varies significantly by municipality. Urban markets with design review boards or historic districts can run 12–20 weeks. Suburban markets with standard commercial zoning often clear in 4–8 weeks.
- Buildout and tenant improvement (8–20 weeks). Depends on condition of the space (second-generation vs. cold shell) and concept complexity. TI budgets for small-format retail (under 2,500 sq ft) typically run $50–$150 per sq ft; full-size stores (5,000–10,000 sq ft) often run $80–$200 per sq ft depending on finish level and market labor costs.
- Pre-opening marketing and soft launch (2–4 weeks). Signage installation, social media, local PR, and staff training. Budget $5,000–$25,000 depending on concept and market.
Total elapsed time from market screen to opening: 5–12 months for a straightforward suburban retail site; 9–18 months for urban, mixed-use, or heavily regulated markets.
When to pay for premium data vs. use public sources: For a single first-location decision, Census ACS data plus a broker relationship may be sufficient for the demographic layer. For a multi-unit expansion program or a high-rent urban site, the cost of a Placer.ai subscription or a one-time Esri Business Analyst report is trivial relative to the lease commitment. A 5-year lease at $35/sq ft on a 3,000 sq ft space is a $525,000 commitment. Spending $3,000 on data to validate the decision is not optional.
What does the timeline and cost look like for opening a retail store?
The timeline section above covers the full sequence from market screen to opening. To complement it, here are the cost buckets that decision-makers most often underestimate when budgeting a new retail location.
Frequently overlooked cost items:
- Utility connection and upgrade fees: Electrical service upgrades for food-and-beverage concepts or high-lighting retail can add $10,000–$40,000 that does not appear in the TI budget.
- ADA path-of-travel upgrades: If the landlord’s base building does not meet current ADA standards, the tenant’s buildout may trigger a path-of-travel obligation covering restrooms, parking, and entrance ramps.
- Signage permitting: Many municipalities require separate sign permits with review timelines of 2–6 weeks. Budget $500–$3,000 for permit fees plus fabrication and installation.
- Security deposit and first/last month’s rent: Landlords for new retail tenants without a track record often require 2–3 months of security deposit in addition to the first month’s rent at lease execution.
- Pre-opening inventory and working capital: Separate from buildout, but often underfunded. A 2,500 sq ft specialty retailer typically needs $30,000–$80,000 in opening inventory depending on category.
How do you benchmark performance after opening?
Post-opening benchmarking closes the loop between the projections you built during underwriting and the reality of actual store performance. Without it, your scoring model never improves.
KPIs to track monthly in year one:
- Sales per square foot (actual vs. projected): The primary performance metric. Track against the expected-case projection from your underwriting model.
- Rent-to-sales ratio (actual): Recalculate monthly using actual sales. A ratio that starts at 11% and trends toward 14% in months 4–6 is an early warning signal.
- Visit count and unique visitor trend: Pull from Placer.ai or your own transaction count. Compare against the pre-opening mobility data baseline to confirm the trade-area demand assumption held.
- Average transaction value: Track against the assumption in your financial model. A lower-than-projected ticket is often more damaging than lower traffic because it compounds across every visit.
- Customer origin distribution: Periodically re-pull origin-destination data to confirm the trade area is performing as modeled. A significant share of customers coming from outside your projected primary trade area may indicate an opportunity to expand; a concentration in a narrower geography than projected suggests the catchment assumption was too optimistic.
- Daypart performance: Compare actual peak hours against the pre-opening daypart forecast. Mismatches often reveal staffing and inventory inefficiencies that compound over time.
Set a 90-day review and a 12-month review as formal checkpoints. At 12 months, compare every key underwriting assumption against actual performance and document the variance. Feed those variances back into the scoring model weights for the next site decision.
How do you manage risk factors in retail site selection?
No site analysis eliminates risk. The goal is to identify which risks are quantifiable, which are manageable, and which are disqualifying.
Economic downturns: Retail sales are cyclical.
Local policy changes: Zoning amendments, parking requirement changes, and business-license restrictions can alter a site’s economics after signing. Review the municipality’s general plan and any pending zoning amendments before committing. In markets with active urban development programs, a rezoning that adds density near your site can be a positive demand signal; one that restricts parking or changes permitted uses is a risk.
Environmental risks: Phase I environmental site assessments are standard for property purchases but less common for retail leases. For sites with prior industrial use, gas station history, or dry-cleaning tenants, request a Phase I or at minimum a review of state environmental database records. Remediation obligations can transfer to tenants under certain lease structures.
Infrastructure changes: A planned highway interchange near your site can double trade-area accessibility within three years. A road diet or transit corridor conversion can reduce drive-by counts. Check the state DOT’s transportation improvement program and the municipality’s capital improvement plan for projects within a 2-mile radius of any candidate site.
Retail market disruption: The shifting retail landscape following major chain closures creates both risk and opportunity. A center that loses an anchor tenant can see co-tenancy clause triggers across multiple leases; it can also create below-market rent opportunities for well-capitalized tenants. Model both scenarios.
Mitigation strategies:
- Build lease flexibility into negotiations: co-tenancy clauses, kick-out rights at year 3 or 5, and caps on CAM expense increases
- Maintain a 6-month operating reserve before opening
- Diversify the portfolio across trade-area types (urban, suburban, mixed-use) to reduce correlated risk
- Review lease terms annually against market rent to identify renegotiation opportunities
What legal considerations go beyond zoning and permits?
Zoning and permitting are the most visible legal hurdles, but several other legal dimensions affect site viability and ongoing operations.
ADA compliance: The Americans with Disabilities Act requires accessible parking spaces, a compliant path of travel from parking to the entrance, accessible entrances (door width, hardware, threshold), and accessible restrooms. For existing buildings, a tenant’s buildout can trigger a path-of-travel obligation requiring the landlord or tenant to upgrade areas outside the leased space. Confirm responsibility allocation in the lease before signing. Non-compliance exposes both landlord and tenant to litigation and regulatory penalties.
Liability and premises liability: Slip-and-fall incidents, inadequate lighting in parking areas, and unsafe common areas generate premises liability claims. Review the lease’s indemnification and insurance provisions carefully. Understand which party is responsible for maintaining common areas and what insurance minimums apply.
Exclusivity and radius restrictions: Many retail leases contain exclusivity clauses preventing the landlord from leasing to a direct competitor in the same center, and radius restrictions preventing the tenant from opening another location within a defined distance. Both provisions can affect your expansion strategy. A radius restriction in a Charlotte-area lease, for example, could prevent you from opening a second location in a nearby submarket.
Environmental indemnification: As noted in the risk section, lease language around environmental conditions matters. Ensure the lease clearly allocates pre-existing contamination liability to the landlord and limits tenant exposure to conditions created during the tenancy.
Signage rights: Sign rights are a lease provision, not just a zoning matter. A lease that grants only a directory listing rather than a building-mounted sign can undermine visibility even at a site that otherwise scores well. Confirm signage rights in writing before executing the lease.
How does community and stakeholder engagement affect site success?
Retail success is partly a function of community fit. A site that scores well on data metrics but faces active community opposition can encounter permitting delays, negative press, and a customer base that never fully adopts the brand.
Neighborhood compatibility: Concepts that align with the existing character of a neighborhood tend to open faster and build loyalty more quickly. A farm-to-table grocer in a neighborhood with strong demand for organic food and an existing farmers’ market has a community tailwind. The same concept in a neighborhood where the primary grocery need is value-priced staples faces a demand mismatch that no amount of marketing resolves.
Local government relationships: For sites requiring conditional use permits, variances, or design review approval, the quality of the applicant’s relationship with local planning staff affects both timeline and outcome. Engaging a local broker or advisor with established relationships in the target municipality reduces permitting friction.
Community benefit agreements: In some urban markets, large retail developments require community benefit agreements covering local hiring, living wage commitments, or contributions to neighborhood improvement funds. These are negotiated at the development level but affect tenant economics through pass-through costs or lease conditions.
Stakeholder mapping: Before committing to a site in a contested neighborhood or a politically sensitive location, identify the key stakeholders: neighborhood associations, business improvement districts, local elected officials, and adjacent property owners. A brief stakeholder engagement process before filing for permits can surface objections early enough to address them, rather than discovering them at a public hearing.
How does omnichannel strategy affect retail site selection?
Physical store location decisions no longer exist in isolation from e-commerce and fulfillment strategy. The store’s role in the omnichannel network shapes which site criteria matter most.
Buy online, pick up in store (BOPIS): A store that serves as a BOPIS fulfillment point needs accessible parking close to the entrance, clear wayfinding, and a layout that supports quick in-and-out trips. Drive-time accessibility becomes more important than pedestrian traffic for this use case. A site with excellent walk scores but constrained parking underperforms as a BOPIS node.
Ship-from-store: Retailers using stores as micro-fulfillment centers need loading dock access or at minimum a rear service entrance, adequate back-of-house storage, and proximity to carrier pickup routes. A street-front urban location with no service access is a poor ship-from-store candidate regardless of its foot-traffic score.

Last-mile delivery proximity: For concepts where same-day or next-day delivery is a competitive differentiator, store location relative to the delivery radius matters. A store in the geographic center of its primary trade area minimizes average delivery distance. A store at the edge of the trade area serves walk-in traffic well but creates longer average delivery routes.
Returns processing: Physical stores that handle e-commerce returns need the square footage and staffing to process them without degrading the in-store experience. Factor returns volume into the space-planning assumptions for any site where the store serves as a returns hub.
Data integration: The foot-traffic and origin-destination data from platforms like Placer.ai can also inform digital marketing targeting. A store’s trade-area origin map is a ready-made geofencing audience for paid social and search campaigns. Sites selected with rigorous trade-area analysis produce better-defined digital audiences as a byproduct.
Why the conventional wisdom on site selection is still wrong
Most retail operators treat site selection as a one-time decision: find the site, sign the lease, open the store. The scoring model and the underwriting model get built once, used once, and then filed away. That is the mistake.
The value of a scoring model is not the score it produces for a single site. It is the calibration that happens when you compare projected performance against actual performance across a portfolio of decisions. A model that has been back-tested against 10 stores and refined over three expansion cycles is a fundamentally different tool than one built fresh for each new site. The weights change. The thresholds tighten. The red flags become more specific.
The other piece of conventional wisdom worth questioning is the primacy of foot traffic as the leading indicator. Traffic is visible, measurable, and easy to present in a board deck. The operators who understand this shift their models toward customer quality metrics and away from traffic counts as the dominant weight.
Post-opening validation is where most teams underinvest. Pulling Placer.ai data 90 days after opening and comparing it against the pre-opening baseline takes two hours. Doing that comparison formally, documenting the variance, and feeding it back into the scoring model takes four hours. That four-hour investment improves every subsequent site decision in the portfolio. The teams that skip it are running the same miscalibrated model on their fifth site that they ran on their first.
Ardorcre brings the full playbook to your site search
Retail site selection done right requires market screening, trade-area modeling, financial underwriting, lease negotiation, and post-opening benchmarking. Most retail operators have the business expertise but not the data infrastructure or the transaction experience to run all five stages at once.
Ardorcre’s commercial advisors cover the full process for retail tenants in the Charlotte MSA and beyond: pulling mobility and demographic data, building the scoring model, underwriting candidate sites against your rent ceiling, and negotiating lease terms including TI allowances, exclusives, and co-tenancy protections. The difference from a standard listing broker is that Ardorcre works from the financial model outward, not from the available inventory inward.
For teams focused on the financing side of a new location, the DSCR guide for commercial real estate walks through how site-level NOI projections connect to loan sizing. For the full retail site selection playbook including scoring templates and worked examples, visit Ardorcre’s retail site selection resource. Ready to evaluate a specific site or market? Contact Ardorcre’s advisory team to schedule a trade-area review.
Sources
This article is general information, not a substitute for advice from a qualified financial advisor. Consult a qualified financial professional about your own circumstances before acting on anything here.