
Charlotte’s office market took in its strongest quarter of 2026 in Q3: 454,723 square feet of net absorption, according to the figure the Charlotte Ledger reported on October 14, 2026. That is a real signal of tenant demand. It is not the whole story. Absorption is measured in square feet, so it favors big submarkets, and it can look healthy when buildings are being removed rather than leased. Owners, investors and tenants get more from the same data by reading it by submarket, by building grade and as a share of inventory.
TL;DR
- Net absorption is the change in occupied space between two dates. Positive means more space is occupied at the end than at the start.
- Q3 2026 was the strongest quarter of the year in Charlotte at 454,723 sq ft, though firms report slightly different totals.
- Vacancy is falling partly because buildings are leaving the inventory through conversion, not only because tenants are leasing.
- Vacancy runs 19.6% in 4 and 5 Star buildings and 4.3% in 1 and 2 Star buildings, so the market average describes neither.
- Judge your own building or lease against its submarket and vintage, not the metro headline.
Table of Contents
- What office absorption means
- What Charlotte’s latest numbers show
- Why two reports can disagree
- Grade matters more than the metro average
- How to use absorption data, by reader
- Our perspective
- Getting a read on your own building or lease
- FAQ
- Sources
What office absorption means
Absorption describes how much space tenants actually occupy in a market over a period. The Metropolitan Council, a regional planning agency, defines net absorption as occupied space at the end of the period minus occupied space at the beginning, where occupied space is usable space minus vacant space.
Two terms come up in almost every report:
- Gross absorption is the total new square footage leased in a period. Net absorption subtracts the space tenants gave back.
- Direct versus total. The corporate real estate association CoreNet Global notes that total net absorption includes sublease space and direct net absorption excludes it. When two reports disagree, check which one each uses.
Positive net absorption means available supply is shrinking. Negative means more space came back to the market than tenants took.
A worked example
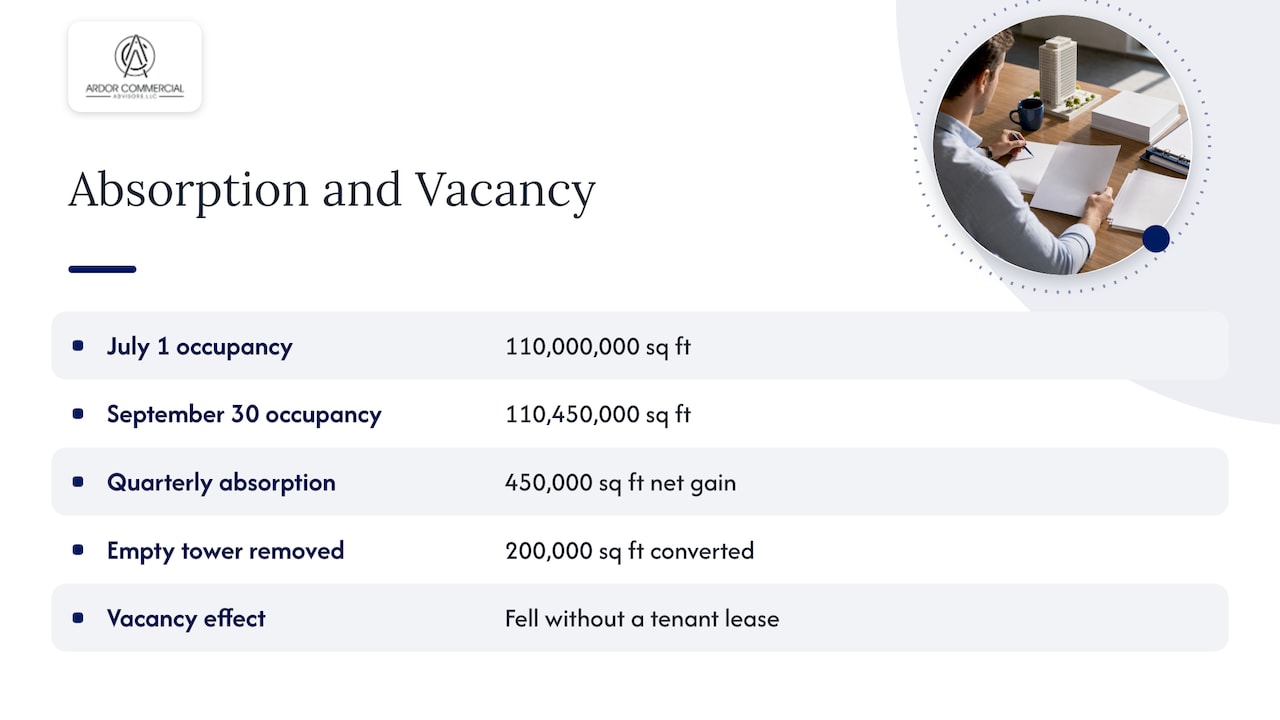
This is an illustration, not Charlotte data. Say a market has 110,000,000 sq ft occupied on July 1 and 110,450,000 sq ft occupied on September 30. Net absorption for the quarter is 450,000 sq ft.
Now say a 200,000 sq ft obsolete tower is converted to apartments and leaves the inventory during the quarter. If it was empty, vacancy drops and the percentage looks better, yet no tenant leased anything. That is why absorption and vacancy should always be read together with what happened to the stock of buildings.
What Charlotte’s latest numbers show
The Charlotte Ledger reported that the Q3 2026 figure of 454,723 sq ft was the strongest quarter so far this year, and noted that market reports differ slightly by firm. Its reporter also cautioned that the industry is notoriously optimistic and that a strong prior quarter does not guarantee where the market is headed. Treat any single quarter as one data point, and expect it to be revised or restated as firms update their inventories.
The backdrop is a growing job base. Southeast Economic Advisors reports Charlotte added 21,900 jobs in the twelve months to June 2026, a 1.6% gain, with only Dallas and Austin adding more among Sun Belt peers. Seven financial institutions have committed to more than 4,100 jobs over fourteen months. Banks hiring is the kind of demand that eventually shows up as leases, and in Ballantyne, Citi’s expansion at the Gragg Building carried a $49.50 gross asking rate in May 2026.
Absorption is only half of the vacancy story
Piedmont Crescent Capital’s August 2026 outlook reports that office vacancy fell 1.2 percentage points over the year to 13.1%, below the national rate for the first time since late 2023. It also reports:
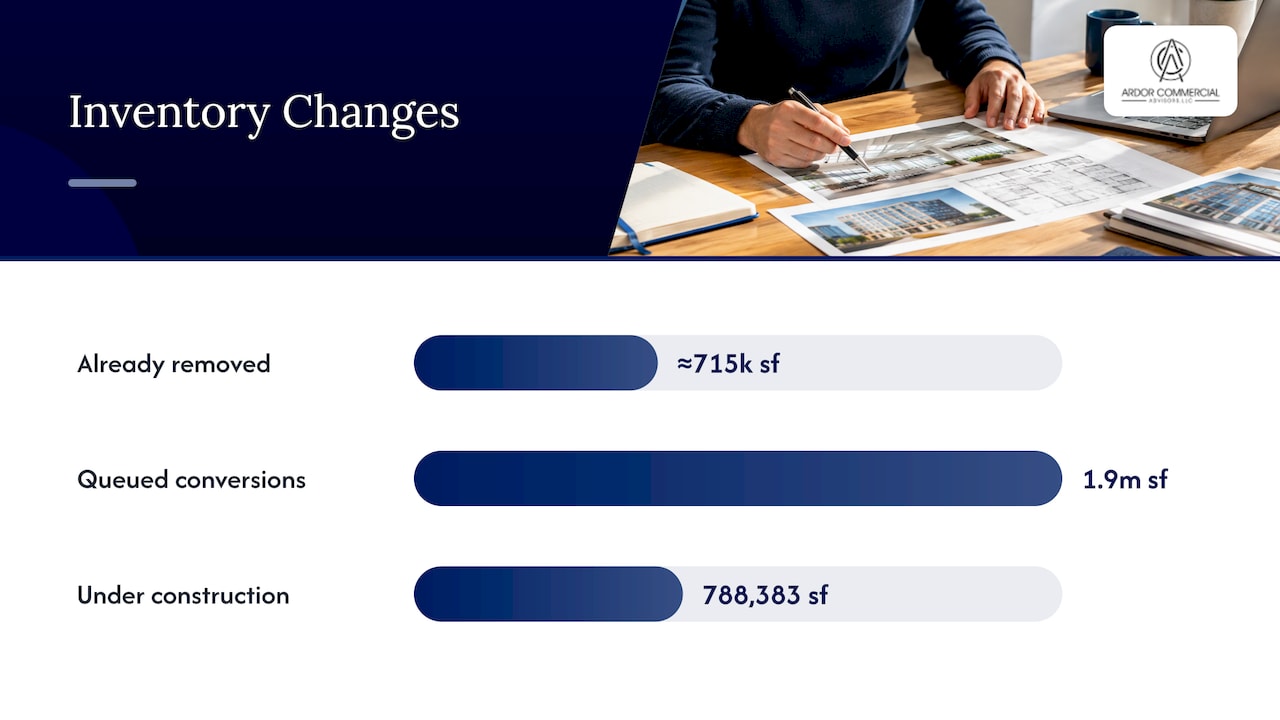
- Roughly 715,000 sq ft has already left uptown’s inventory through conversion, with another 1.9 million sq ft queued.
- Only 788,383 sq ft, or 0.6% of a 136 million sq ft market, is under construction.
- Q2 2026 was the lowest delivery quarter in CoStar’s Charlotte record.
The report’s argument is that Charlotte is tightening by subtraction rather than demand: vacancy falls through building removals as much as through leasing. For an owner, that is useful news about supply. For a tenant, it explains why good space is getting harder to find even when absorption is only moderate. Our Charlotte office pipeline page tracks what is being built, converted and leased.
Conversion dominates because new construction does not pencil. Southeast Economic Advisors points to a 6.60% mortgage rate and current construction costs keeping new starts near zero, while the Brooklyn and Church redevelopment is delivering at a basis roughly 20% below new construction. Eight uptown conversions are underway against one office tower.
Why two reports can disagree
If you have seen wildly different Charlotte vacancy figures, you are not imagining it. Southeast Economic Advisors found three firms putting vacancy at 13.1%, 23.9% and 26.4% in the same quarter because each measures a different inventory universe. Some count only certain building classes or sizes; others include far more product.
Before you rely on a number, check four things:
- Inventory universe. Which buildings are counted, and does the set change between quarters?
- Direct or total. Is sublease space included?
- Period. Quarterly, year to date or trailing twelve months?
- Geography. Metro, submarket or a single corridor?
A second trap is size. Net absorption in square feet, in the words of Southeast Economic Advisors, mostly measures how large a submarket already is. The firm scored all 81 Charlotte submarkets on a composite of absorption as a share of inventory (40%), asking rent growth (30%), vacancy (20%) and pipeline (10%, as a deduction). The result reshuffles the map: Airport ranks third on raw square feet but ninth on the composite, while Uptown ranks ninth on square feet but third.
Grade matters more than the metro average
The most useful split in Charlotte right now is by vintage. The August 2026 outlook reports vacancy of 19.6% in 4 and 5 Star buildings at $44.36 per square foot, against 4.3% in 1 and 2 Star buildings at $26.23. Limited availability in top-tier space and abundant availability in the oldest space are both true at once, depending on which building you are standing in.
| Building tier | Vacancy | Asking rent (per SF) |
|---|---|---|
| 4 and 5 Star | 19.6% | $44.36 |
| 1 and 2 Star | 4.3% | $26.23 |
| Metro-wide (one firm’s count) | 13.1% | n/a |
Source: Piedmont Crescent Capital, Charlotte CRE Outlook, August 2026. Metro vacancy varies by firm, as explained above.
For more on what tenants pay, see our breakdown of Charlotte office rents per square foot.
How to use absorption data, by reader
If you own or invest in an office building
Southeast Economic Advisors tells owners and investors to focus on net operating income and on demand as a share of inventory. Its outlook is that cap rates will not compress, so value has to come from income rather than from the exit price. In practice:
- Convert absorption into a percentage of the inventory you compete with, not a raw square-foot figure.
- Compare your building with its own submarket and grade.
- Underwrite income growth from leasing, not from a yield shift. A valuation that models cash flow explicitly, such as the DCF modeling in our commercial property valuation, puts the leasing assumption where it belongs.
- Match the submarket to the strategy. Our Charlotte submarket guide covers where to buy, sell or refinance.
If you are an office or medical tenant
The same advisers say the relevant comparison for leasing is the submarket and the vintage, not the market. A renewal negotiated off the 13.1% metro figure describes neither a 19.6%-vacancy 4 and 5 Star building nor a 4.3%-vacancy 1 and 2 Star one. If your building is in the tight tier, expect less leverage and start your search earlier. If it is in a high-vacancy tier, you have room to ask for concessions.
Two practical steps. First, ask for the submarket and grade vacancy behind any “the market is soft” or “the market is tight” argument. Second, build in time: our 3 to 6 month commercial leasing timeline shows how long a medical or office search realistically takes.
Our perspective
Absorption is a good scoreboard and a poor forecast. We would not make a buy, sell or lease decision off one quarter’s headline, whichever firm published it.
What we do instead is anchor on the building. Which submarket is it in? Which tier? Who are the likely tenants, and when do their leases roll? Charlotte’s market is bifurcated, and the owner of a 4 or 5 Star tower and the owner of an older, smaller building are in two different markets, even on the same street.
For tenants, the same logic applies. Our advisors represent tenants and landlords, and we bring submarket-level data, lease analysis and customized market reporting to the table so the conversation starts from facts about your building, not the metro average.
Jim
Getting a read on your own building or lease
If you own office or medical space in the Charlotte MSA, or you are deciding where to lease, we provide commercial leasing, tenant representation, property management and commercial property valuation for building owners, investors and tenants. Our advisors also handle landlord representation, and we review leases before you sign. See all of our commercial real estate services.

To see how a lease is built before negotiating, start with our lease review and CAM reconciliation analysis and our guide to triple net leases.
FAQ
What is net absorption in office real estate?
Net absorption is the change in occupied space in a market between two dates. It equals occupied space at the end of a period minus occupied space at the start, with occupied space defined as usable space minus vacant space. A positive number means tenants occupy more space than before.
What was Charlotte’s office absorption in Q3 2026?
The Charlotte Ledger reported 454,723 sq ft for Q3 2026, the strongest quarter of the year so far. Firms use different inventories, so their totals differ slightly. Check the publisher’s definitions before comparing numbers.
Does falling vacancy always mean more leasing?
No. Vacancy can fall because older buildings are converted or demolished and leave the inventory. Charlotte has roughly 715,000 sq ft already converted in uptown and 1.9 million more queued, according to the August 2026 outlook cited above. Read vacancy together with absorption and building removals.
Why do Charlotte vacancy rates differ so much between reports?
Because each firm counts a different set of buildings. One analysis found three firms reporting 13.1%, 23.9% and 26.4% in the same quarter. Direct versus sublease treatment and geography also change the result.
Which absorption number should a tenant use when negotiating?
Use the vacancy and absorption for your submarket and building tier, not the metro average. Vacancy is 19.6% in 4 and 5 Star buildings and 4.3% in 1 and 2 Star buildings, so the two groups give a tenant very different leverage.
Sources
- Capital crunch isn’t stopping tenant activity, The Charlotte Ledger
- Charlotte is Getting Tighter by Subtraction, Southeast Economic Advisors
- Charlotte CRE Outlook, August 2026, Piedmont Crescent Capital
- Calculating Absorption, Metropolitan Council
- The Essential Guide Glossary, CoreNet Global
- Net Absorption formula, Wall Street Prep