
Tenant mix planning is the deliberate process of selecting, placing, and balancing tenants by category, size, and position to maximize traffic, dwell time, and net operating income. The objective is straightforward: pair frequency-driving categories like grocery and fitness with dwell-building categories like food and wellness so visits compound into cross-shopping. The first move for any owner is a tenant-mix audit built on visit-frequency and trade-area data, not instinct or legacy leasing relationships.
TL;DR:
- Fitness operators draw about 4.2 visits monthly, the highest rate among major retail categories; grocery remains reliable, while apparel works better as a destination.
- Grocery centers typically assign 50% to 60% of leasable area to anchors, while lifestyle and mixed use projects depend more on clusters of mid size tenants.
- Place tenants with at least 30% customer overlap beside one another, but check loading, odors, and peak hours before committing to an adjacency.
- Run a full audit annually, refresh lease and vacancy data quarterly, and prioritize three to five opportunities by impact and feasibility.
Table of Contents
- Why tenant mix planning drives asset performance
- Tenant category framework: roles, space allocation, and fit
- Data and analytics: metrics and tools that work in practice
- Step-by-step tenant mix audit and gap analysis
- Placement and adjacency: sequencing tenants inside a center
- Execution: leasing tactics, timing, and stakeholder coordination
- Monitoring and governance: KPIs, reporting, and intervention triggers
- Ardor CRE perspective and practitioner checklist for medical and office owners
- Impact of tenant mix on lease structure and negotiations
- Strategies for balancing national chains versus local tenants
- Considerations for tenant mix in mixed-use developments
- Adapting tenant mix planning over economic cycles and market shifts
- Integration of tenant mix planning with property branding and marketing strategies
- What the data actually supports about tenant mix planning
- How we help owners put a tenant mix plan into action
- FAQ
- Sources
Why tenant mix planning drives asset performance
Tenant mix is not a leasing afterthought. It is the mechanism that sets rent growth, occupancy stability, and resale value, because the categories you choose determine how often people show up and how long they stay once they arrive. A property anchored by a high-frequency tenant generates more total visits for every other tenant on the pad, which is why anchor selection carries weight far beyond its own rent roll line.
The connection to net operating income runs through three channels: visit frequency, dwell time, and cross-shopping between tenants. When a center pairs a frequent-visit anchor with tenants that benefit from that traffic, percentage rent and renewal rates both tend to firm up, because tenants can see the foot traffic translating into sales per square foot. Retention follows the same logic. Tenants who consistently hit their sales targets renew; tenants placed in the wrong trade area or stranded without complementary neighbors churn, and churn resets leasing costs, downtime, and tenant improvement spend.
Fitness operators draw customers to a center roughly 4.2 times per month, the highest visit frequency of any major retail category, which explains why fitness has moved from a secondary user to a preferred anchor in neighborhood and lifestyle centers. Coffee and grocery follow at lower but still meaningful frequencies, and apparel, once the default anchor, has lost ground as a frequency driver.
That shift changes how owners should think about anchor tenancy:
- Fitness anchors generate repeat visits that benefit every tenant sharing their parking field and sightlines.
- Grocery anchors remain a stable frequency driver and a reliable co-tenancy clause trigger for in-line tenants.
- Apparel anchors carry more e-commerce exposure and now function better as destination tenants than as frequency engines.
- Food and beverage tenants convert frequency into dwell time, which supports secondary and tertiary tenant sales.
Owners who build their rent roll around frequency and dwell data, rather than around whichever national brand is actively expanding, tend to see steadier occupancy through lease cycles.
Tenant category framework: roles, space allocation, and fit
Every workable tenant mix strategy starts with a shared vocabulary for what each tenant is supposed to do inside the property. Four roles cover nearly every leasing decision:
- Anchors draw the baseline traffic the rest of the center depends on; typically grocery, fitness, or a major off-price retailer.
- Frequency drivers bring people back often even without being the primary draw, such as coffee, banking, or quick-service food.
- Dwell drivers extend the length of a visit and raise the odds of a second or third stop, including sit-down restaurants, salons, and entertainment concepts.
- Specialty and service tenants fill rounding-out space, from medical and dental practices to boutique retail and personal services, and often stabilize income because their leases run longer and their foot traffic is less seasonal.
Space allocation follows the center’s format more than any fixed formula, but there are useful starting points. In grocery-anchored centers, a conventional allocation puts roughly 50 to 60% of gross leasable area under anchor tenancy, with the remaining space split among specialty and service tenants that benefit from the anchor’s draw without competing for the same square footage. Lifestyle centers and mixed-use developments typically run a lower anchor share, because the format depends on a cluster of mid-size draws, dining, and entertainment rather than one dominant box.
Matching banners to trade-area fit means reading the demographic and psychographic profile of the surrounding population before signing a letter of intent, not after. A premium fitness concept underperforms in a trade area with low discretionary income regardless of how well it performs elsewhere in a chain’s portfolio, and a value-oriented grocery banner can outdraw a premium one in the same footprint if the local income band skews lower. The ICSC Guide for Improving Tenant Mix frames this as building a data-backed leasing story: gathering market, demographic, and psychographic detail into a package that makes the case for a specific tenant to a specific site, rather than pitching a generic space to whichever broker calls first.
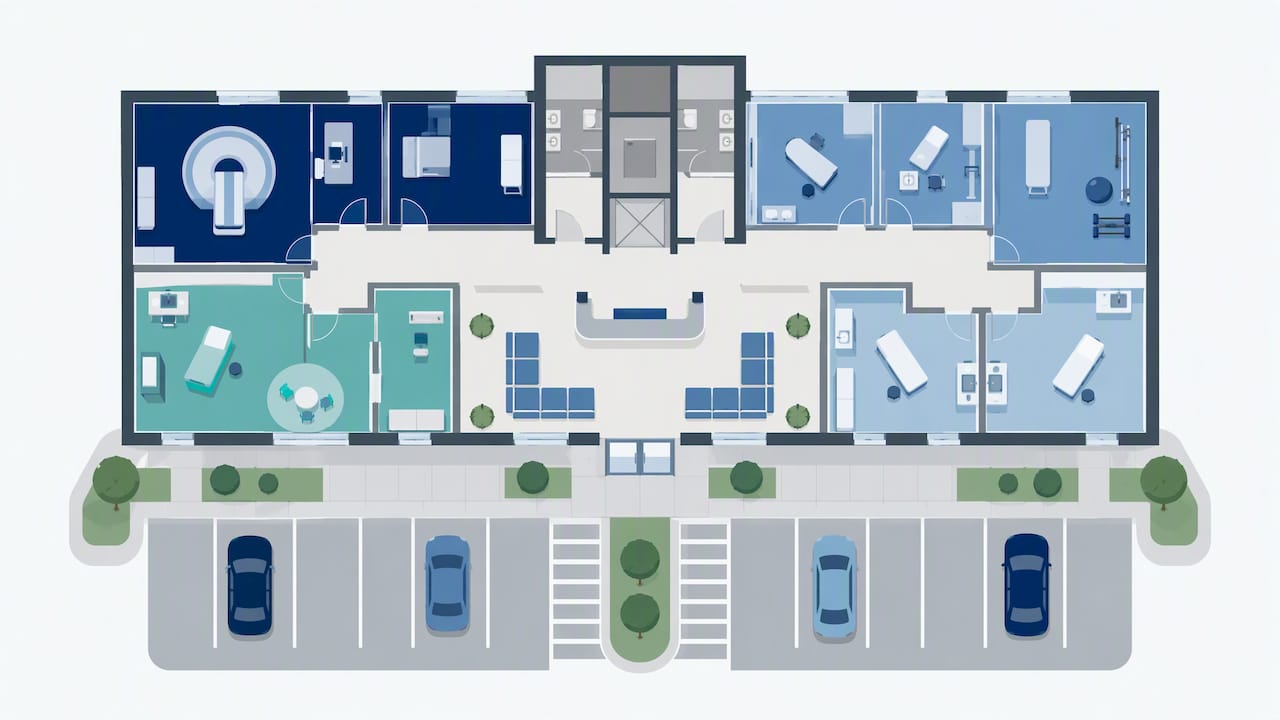
For medical office and professional office buildings, the same category logic applies with different inputs. Patient and client access, parking ratios, and complementary practice adjacencies (imaging next to orthopedics, pediatrics near family practice) substitute for retail foot traffic as the frequency and dwell signals that matter.
Data and analytics: metrics and tools that work in practice
Tenant mix decisions used to rely on broker instinct and whatever lease comps were on file. That has changed. Tenant-data platforms and mobile and location analytics now let landlords run white-space analysis and spot co-tenancy patterns with far more precision than a windshield survey and a gut check.
Four metrics should anchor any data workflow:
- Visit frequency measures how often a customer returns to a tenant or property in a given month, the clearest signal of which categories justify anchor positioning.
- Dwell time tracks how long visitors stay once they arrive, a proxy for how likely they are to cross-shop other tenants.
- Cross-visitation quantifies the overlap between two tenants’ customer bases, which tells you whether a proposed adjacency will actually reinforce traffic.
- Leakage identifies trade-area spending that currently flows to competing centers, pointing to categories missing from the current mix.
In practice, these metrics come together through a repeatable decision flow: ingest trade-area and mobility data alongside internal sales and lease data, score prospective tenants on frequency and dwell potential, run adjacency optimization against cross-visitation thresholds, then sequence lease timing and incentives inside a DCF or NOI model. Centralizing third-party mobility feeds and internal leasing data in a data warehouse, queried through a standard BI tool, turns a one-time leasing analysis into a living dashboard that updates as new tenants sign and vacate. Our own retail site selection work for 2026 clients leans on this same combination of trade-area and mobility data to evaluate new locations before a letter of intent goes out.
Pro Tip: Run cross-visitation analysis before finalizing any adjacency plan. Pairing two tenants with no real customer overlap wastes the strongest placement spots in the center.
None of this replaces judgment. Analytics platforms surface patterns and shortlist candidates, but a leasing team still has to weigh covenant strength, build-out cost, and relationship history, and a platform cannot negotiate a lease. Treat the data as a filter that narrows fifty prospects to five, not as the final decision-maker.
Step-by-step tenant mix audit and gap analysis
A tenant mix audit is the single most useful exercise an owner can run before renewal season or a refinance. It follows a consistent sequence:
- Inventory every tenant and lease, including square footage, category, lease expiration, renewal options, and co-tenancy clauses tied to specific anchors.
- Map vacancies and adjacencies on a current site plan, noting which spaces sit next to high-traffic anchors versus dead zones with poor visibility.
- Pull trade-area demand data, including demographics, psychographics, and visit-frequency benchmarks for the categories already in the center and categories under consideration.
- Run a leakage and white-space analysis to identify categories the trade area supports that the current tenant roster does not capture.
- Score each gap by impact versus ease, separating quick wins (a short-term pop-up filling a small vacancy) from strategic repositioning (replacing an underperforming anchor).
- Prioritize the top three to five opportunities and build a leasing timeline around upcoming lease expirations.
The data fields worth collecting during step one and three go beyond the standard rent roll:
- Lease expiration date and any co-tenancy or exclusive-use clauses that constrain future leasing.
- Historical sales per square foot where available, by tenant and by category.
- Trade-area population, household income, and age distribution within a 1, 3, and 5-mile radius.
- Mobile and location data on visit frequency and dwell time for existing tenants and comparable centers nearby.
Gap analysis works best as a simple two-axis exercise: plot each potential move on impact (how much it could lift NOI or occupancy) against ease (how fast it can close given lease terms and capital needs). A vacant endcap with no co-tenancy restrictions and strong trade-area demand for fast-casual dining is a quick win. Replacing an anchor mid-lease because a better-performing category exists elsewhere in the market is a strategic repositioning that takes longer and carries buyout or holdover risk.
The right cadence is an annual full audit, refreshed with quarterly updates to lease status, vacancy, and any material shifts in trade-area mobility data. Annual-only reviews miss mid-cycle tenant distress; quarterly-only tracking without a full annual reset loses sight of the broader trade-area picture. Running both keeps the leasing team working from current data without re-litigating the entire strategy every ninety days. For properties heading toward a sale or refinance decision, this audit also feeds directly into underwriting, since lenders increasingly want to see tenant mix durability alongside the standard DSCR calculation.
Placement and adjacency: sequencing tenants inside a center
Where a tenant sits matters almost as much as which tenant you sign. Endcaps and road-facing suites carry the highest visibility in the center and should go to tenants that either drive their own traffic or benefit the most from impulse visibility, such as quick-service restaurants, banks, and specialty retail with strong sign presence. Tenants that depend on destination visits rather than visibility, like medical offices or larger-format service providers, can sit deeper in the center without losing performance.
Clustering complementary uses amplifies this effect. A wellness cluster that groups a gym, a juice bar, and a physical therapy practice creates a reinforcing loop of visits among people already primed to use adjacent services. An F&B district that puts several restaurants within a short walk of each other extends dwell time across the whole group rather than cannibalizing any single tenant. Grocery-anchored centers benefit from placing frequency-driving service tenants (dry cleaning, pharmacy pickup, coffee) directly along the path between the parking field and the grocery entrance.
The adjacency decision itself should be data-led rather than relationship-led:
- Prioritize pairs with strong cross-visitation; tenant pairs with roughly 30% or higher cross-visitation are strong candidates for adjacent placement because they reinforce each other’s traffic.
- Check operational compatibility before finalizing a pairing, since shared loading docks, odor concerns, or conflicting peak hours can offset the traffic benefit.
- Reserve endcaps for tenants with proven visibility-driven sales rather than defaulting to whichever tenant signs first.
- Avoid clustering direct competitors unless the trade area clearly supports a destination category (a cluster of discount apparel, for example).
Mapping these adjacency rules onto a CAD site plan before marketing a vacancy prevents the common mistake of leasing a space to the first qualified tenant regardless of fit.
Execution: leasing tactics, timing, and stakeholder coordination
A tenant mix plan only matters once it turns into signed leases. That starts with a lease calendar that maps every expiration, option period, and co-tenancy trigger across the next 24 to 36 months, so leasing decisions get sequenced instead of reactive. A lease expiring in a weak position (an underperforming anchor nearing its option date) should move to the top of the leasing team’s calendar well before the option deadline forces a decision under pressure.
Deal structure should flex with strategic priority. Tenant improvement allowances and graduated rent schedules make sense for a category the audit identified as a strategic priority, where getting the right tenant signed outweighs maximizing starting rent. Short-term pop-ups are useful for filling a vacancy while a longer-term leasing process plays out, keeping the space activated rather than dark. Percentage rent clauses work best with tenants whose sales performance is easy to verify and whose category has genuine upside tied to the center’s traffic, such as restaurants or specialty retail, rather than service tenants with flat revenue patterns.
Preparing a leasing pitch means assembling the data room before the first broker call, not after interest develops, and using tools like Brokers Connect can streamline lender matching and deal packaging for repositioning projects:
- Trade-area demographics, psychographics, and visit-frequency benchmarks for the target category.
- Current tenant roster with co-tenancy clauses and renewal timing clearly flagged.
- A site plan showing proposed adjacencies and the traffic logic behind them.
Pro Tip: Share the trade-area data and adjacency logic with brokers before the space hits the market. A tenant’s leasing team is far more likely to move quickly when the pitch already answers their underwriting questions.
Our team’s lease abstract process is where this data room work typically starts, since pulling clean expiration and clause data out of existing leases is the foundation for every leasing decision that follows.
Monitoring and governance: KPIs, reporting, and intervention triggers
A tenant mix plan is not a one-time project. It needs an ongoing dashboard and clear ownership so drift gets caught before it shows up in a vacancy report. A workable KPI dashboard tracks monthly visits per tenant and per category, average dwell time, sales per square foot where reported, occupancy by category, and a rolling lease-event timeline showing upcoming expirations and options.
Reporting cadence should match the decision speed each metric supports. Visit and traffic data can be reviewed monthly, since mobility data updates continuously and catching a frequency drop early gives more time to react. Sales performance and occupancy trends are better reviewed quarterly, aligned with tenant reporting cycles and asset management check-ins.
Ownership should be explicit rather than assumed. Leasing teams own category strategy and prospect pipeline, asset management owns the NOI and valuation implications of mix changes, and property management owns day-to-day tenant relationships and the operational data (foot traffic counts, parking utilization) that feeds the dashboard. Fitness tenants draw roughly 4 visits per month compared to 2 to 3 for grocery, a gap wide enough that a sudden drop in either category’s visit count against that baseline should trigger a review rather than wait for the next quarterly meeting.
Clear thresholds keep intervention from becoming guesswork:
- A sustained drop in visit frequency against category benchmarks should trigger a conversation with that tenant about operations or marketing support.
- Declining cross-visitation between previously paired tenants signals an adjacency or merchandising problem worth remerchandising around.
- Occupancy or sales trends falling behind trade-area comparables for two consecutive quarters should trigger a formal remarketing decision rather than another renewal at flat terms.
Ardor CRE perspective and practitioner checklist for medical and office owners
Medical office and multi-tenant office buildings follow the same tenant mix logic as retail, with patient and client access substituting for foot traffic as the core performance signal. When we advise owners on these asset types, a consistent checklist shapes the conversation:
- Confirm parking ratios and entrance access support the specific practice types under consideration, since a surgical or imaging tenant has different patient-flow needs than a general practice suite.
- Map adjacency opportunities between complementary practices, such as placing physical therapy near orthopedics or pediatrics near family medicine, to capture referral-driven visits.
- Review lease terms relevant to practitioners specifically, including buildout allowances for medical-grade infrastructure and exclusive-use clauses that protect a specialty tenant from a competing practice signing nearby.
- Check that existing co-tenancy and lease-expiration data is clean and abstracted before marketing any vacancy, since incomplete lease files slow down every leasing conversation that follows.
We link these tenant-mix moves directly to lease-up timelines and valuation outcomes: a building with a deliberate, complementary mix of medical and professional tenants typically leases faster and supports a stronger valuation than one filled opportunistically. That process usually starts with the same two steps regardless of asset type: a data-driven tenant retention review for the existing roster, paired with a lease calendar audit to flag upcoming decision points before they become urgent.
Impact of tenant mix on lease structure and negotiations
The categories already in a building shape the leverage available in every new negotiation. A center with strong anchor-driven traffic can negotiate higher base rent and shorter tenant improvement packages, because prospective tenants are buying into proven foot traffic rather than an unproven location. A building with a weaker or less complementary mix often has to offer more concessions, whether through extended free rent, larger improvement allowances, or more flexible exit clauses, to compensate for the traffic risk a new tenant is taking on.
Co-tenancy clauses tie this directly to lease structure. A tenant that signed specifically because of an anchor’s presence will often negotiate a co-tenancy clause allowing reduced rent, or in some cases termination rights, if that anchor vacates. That makes anchor selection a negotiation lever for every other lease signed afterward, not just a standalone leasing decision.
Percentage rent structures also depend on mix. A tenant whose sales genuinely benefit from the surrounding traffic, placed well within a complementary cluster, is a reasonable candidate for percentage rent above a base. A tenant placed in a weak location within the same building has little reason to accept that same structure, since their sales performance has less to do with the center’s overall draw. Reviewing these clauses carefully during CAM reconciliation and lease review work often reveals mismatches between what a lease assumes about tenant mix and what the current rent roll actually delivers.
Strategies for balancing national chains versus local tenants
National chains bring covenant strength, marketing budgets, and predictable sales performance, which matters to lenders evaluating a refinance or a prospective buyer underwriting a purchase. Local and regional tenants bring differentiation and, often, a stronger connection to the specific trade area, since an independent restaurant or boutique can tailor its offering in ways a national brand’s format standards do not allow.
The balance that tends to work best pairs one or two national anchors, chosen for their frequency-driving traffic, with a majority of local and regional tenants in the specialty and dwell-driver categories. This keeps the center from feeling interchangeable with every other shopping center carrying the same five national tenants, while still anchoring the property with the lease credit and visit frequency that national brands reliably deliver.
Lease terms should reflect the different risk profile each group carries. National tenants typically negotiate longer terms and lower per-square-foot rent in exchange for credit strength and immediate traffic. Local tenants often need more flexible terms (shorter initial periods, percentage rent structures, modest improvement allowances) since their track record is shorter and their capital is more constrained, but they frequently deliver the differentiation that keeps a center relevant in its trade area over a full lease cycle.
Considerations for tenant mix in mixed-use developments
Mixed-use developments add a layer of complexity that single-use retail or office properties do not face: the tenant mix has to work across residential, office, and retail components simultaneously, with each use supporting foot traffic for the others. Ground-floor retail in a mixed-use project benefits enormously from a captive residential and office population, but that population alone rarely generates enough volume to support more than a handful of frequency and dwell-driver tenants.
Getting this right starts with sequencing: ground-floor retail should lean toward categories that serve the property’s own residents and office tenants first (coffee, quick-service food, a small-format grocery or pharmacy) before chasing destination retail that depends on outside trade-area draw. Destination retail and larger restaurant concepts work better once the project has enough residential density or office square footage to support them independently of the captive population.
Parking and access planning also shape tenant mix decisions more directly in mixed-use settings than in standalone retail, since shared parking between uses changes peak-demand timing throughout the day. A tenant mix that works well in a standalone shopping center can underperform in a mixed-use setting if evening residential parking demand conflicts with a restaurant’s peak hours, making this coordination worth mapping before finalizing ground-floor leasing.
Adapting tenant mix planning over economic cycles and market shifts
Tenant mix is not a static plan set once and left alone through a full ownership cycle. Categories that perform well during expansion, destination retail and discretionary dining in particular, tend to be the first to show softness when consumer spending tightens, while frequency-driving categories like grocery, fitness, and essential services hold up more consistently through a downturn.
That difference argues for building some resilience into the mix even during strong markets, rather than maximizing rent with discretionary tenants at the expense of frequency drivers that perform steadily across the cycle. A center weighted too heavily toward destination and discretionary categories faces more volatility in both occupancy and valuation when conditions shift, while a mix anchored by frequency drivers has a steadier floor to lease against even if headline rents are lower.
Market shifts within a category also matter. Apparel’s share of visit frequency has declined while fitness, coffee, and grocery visit growth has risen, a structural shift rather than a cyclical dip, which is why tenant mix planning should distinguish between short-term tactical adjustments and longer-term structural repositioning. Mixing long-term stable demand data with more current mobility signals helps separate a temporary dip from a category in permanent decline, so owners do not overreact to a single soft quarter or underreact to a real structural shift.
Integration of tenant mix planning with property branding and marketing strategies
The tenant roster is a center’s branding, whether an owner treats it that way or not. A property anchored by fitness, grocery, and a curated set of local food and service tenants communicates a different identity to the trade area than one filled with discount retail and vacant endcaps, and that identity shapes who chooses to shop, dine, or lease office space there.
Marketing a property effectively means leaning into the identity the tenant mix already creates rather than running generic advertising disconnected from what is actually on-site. A wellness-clustered center can market itself around health and convenience; a mixed-use project with strong F&B density can build programming and events around that cluster to extend dwell time further. Placemaking investments (seating, events, walkability improvements) compound the frequency advantages a well-chosen tenant mix already creates, giving visitors additional reasons to return beyond the tenants themselves.
This connection runs both directions. A property’s marketing and branding efforts should also inform which categories get prioritized in future leasing, since a center building a reputation around a specific identity benefits from reinforcing that identity with new tenants rather than diluting it with an unrelated category that happens to be actively expanding. Treating leasing and marketing as separate functions misses this feedback loop and often results in a tenant roster that fights the property’s own brand positioning.
What the data actually supports about tenant mix planning
Most tenant mix advice still treats the anchor tenant as the center of gravity and everything else as filler. The visit-frequency data argues against that. A fitness operator drawing four visits a month and a coffee tenant drawing two and a half both outperform plenty of traditional anchors on sheer repeat traffic, which means the real strategic question is not “who is the anchor” but “which three or four tenants, in combination, generate the most compounding visits.”
The conventional advice also underweights dwell time relative to frequency. A tenant that brings people back often but keeps them for ten minutes contributes less to cross-shopping than one that holds attention for an hour, and most leasing decisions still get made on rent per square foot and covenant strength without asking which number matters more for a specific vacancy.
If there is one priority for 2026, it is building the audit habit before chasing new categories: know your current cross-visitation and frequency numbers before deciding what is missing. Owners who skip that step end up reshuffling tenants based on whichever broker call came in last, not on what the trade area actually supports.
— Jim
How we help owners put a tenant mix plan into action
Planning the right tenant mix is one part of the equation. Getting it signed, leased, and performing is another, and that is where our team spends most of its time working alongside medical office, professional office, and retail owners across the Charlotte MSA. We combine landlord and tenant representation with the underlying data work, so a trade-area audit turns into an actual leasing pipeline rather than a report that sits unused.
Our services relevant to a tenant mix initiative include:
- Landlord and tenant representation to run the leasing process once target categories are identified.
- Retail site selection and trade-area analysis to validate demand before committing to a new category or tenant.
- Lease review and CAM reconciliation to make sure existing lease terms support the mix you are trying to build.
- DCF and NOI modeling to quantify how a proposed tenant mix change affects value before you commit capital to it.
If you are weighing a repositioning, a lease calendar review, or want a second opinion on a proposed anchor swap, our commercial real estate services page is the right place to start a conversation with our team.
FAQ
What is a tenant mix?
A tenant mix is the specific combination of tenant categories, sizes, and placements within a commercial property, chosen to balance traffic generation, dwell time, and income stability. A well-built mix pairs frequency-driving tenants like grocery or fitness with dwell-building tenants like restaurants and services so visits compound into cross-shopping between businesses.
What are the four main elements of the retail mix?
Retail tenant mix planning generally organizes tenants into four roles: anchors that drive baseline traffic, frequency drivers that bring repeat visits, dwell drivers that extend visit length, and specialty or service tenants that round out the center. Allocating space across these four roles, rather than filling vacancies as they come up, is what separates a planned mix from an accidental one.
What kind of tenants do landlords prefer?
Landlords increasingly favor service-first categories like fitness, grocery, food and beverage, and wellness, since fitness tenants draw about 4.2 visits per month and grocery and coffee follow closely behind, making these categories reliable frequency drivers. Covenant strength and sales performance data also weigh heavily, since both reduce the risk that a tenant underperforms or defaults mid-lease.
Who benefits most from a percentage lease?
Tenants whose sales performance is closely tied to a center’s foot traffic, such as restaurants and specialty retail in well-placed adjacencies, are the strongest fit for a percentage rent structure, since their upside genuinely tracks the property’s draw. Landlords benefit as well, since percentage rent lets base rent stay competitive while still capturing additional income when a well-placed tenant performs above expectations.
Sources
- Shopping center tenant mix playbook for 2026
- Commercial assets explained: tenant mix, ownership and lease impacts on inspections