
Charlotte multifamily cap rates are running roughly 5.25% to 5.75% as of the 2026 Charlotte commercial real estate market report, with stabilized Class A deals in tighter submarkets pricing at the low end and value-add or workforce housing pushing toward the upper end and beyond. That range sits close to what several Southeast metros are showing, where Sun Belt cap rates have generally held between 4.75% and 5.5%, meaning Charlotte trades at a modest discount to some regional peers rather than a bargain.
Here’s the quick read before you dig into submarkets and asset classes:
- Metro multifamily average: approximately 5.25% to 5.75%
- Vacancy: near 6.8% metro wide
- Regional comparison: Charlotte tracks close to, sometimes slightly above, other Southeast markets in the 4.75% to 5.5% band
Quick fact: A cap rate in the mid 5% range means a $10 million property throwing off roughly $550,000 in annual net operating income. That’s the entire cap-rate story in one comparison.
Key Takeaways
| Point | Details |
|---|---|
| Metro benchmark | Multifamily cap rates sit near 5.25% to 5.75% as of the 2026 market report. |
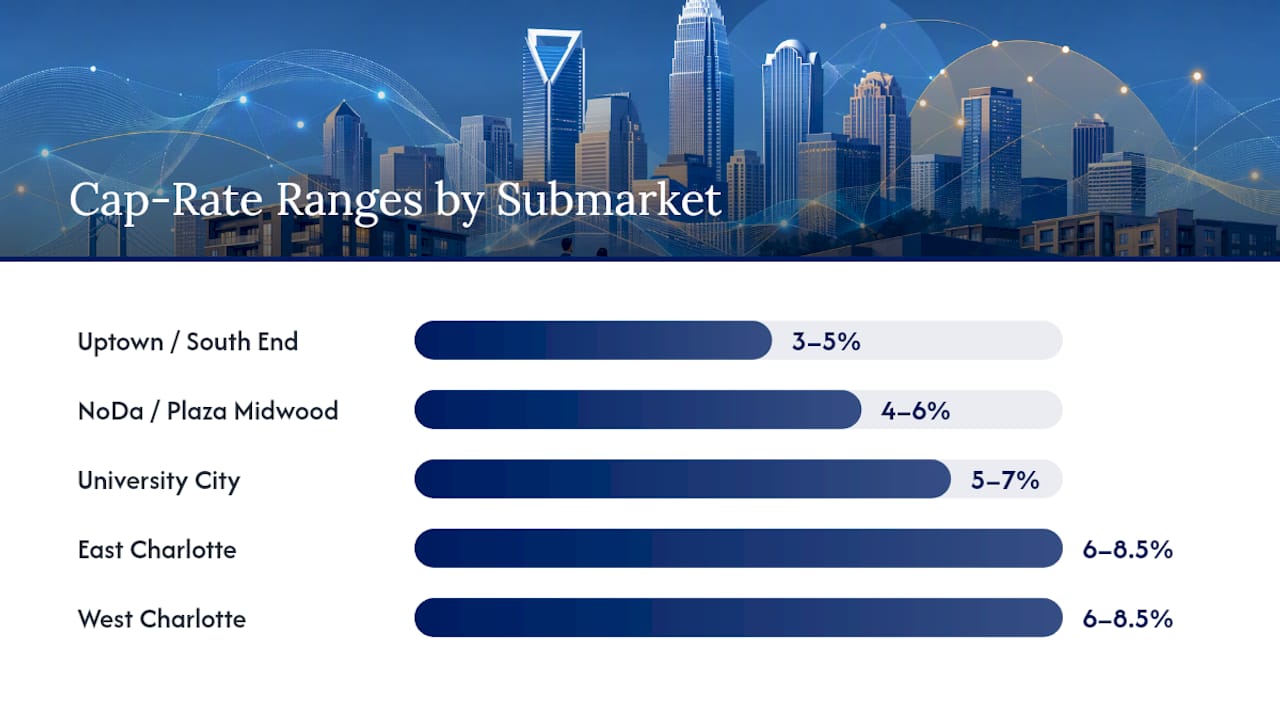
| Submarket spread is wide | Uptown and South End compress to 3% to 5%, while East and West Charlotte run 6% to 8.5%. |
| Cash buyers compress mid-tier pricing | 61.3% of tracked 2026 investor purchases closed in cash, tightening cap rates in competitive price bands. |
| Financing structure shifts pricing | Small 2 to 4 unit properties often trade at lower cap rates due to residential-style financing terms. |
| Verify before you trust the number | Confirm trailing versus stabilized NOI and check Mecklenburg reassessment timing before underwriting. |
Table of Contents
- What Do Charlotte Cap Rates Look Like Right Now?
- What Are Cap-Rate Ranges by Asset Class and Neighborhood?
- What’s Driving Cap Rates Higher or Lower in Charlotte?
- How Do You Calculate and Use a Cap Rate?
- Where Are Charlotte Cap Rates Headed Next?
- Where Does This Cap-Rate Data Come From?
- Where Should Charlotte Investors Get Underwriting Help?
- What’s the Real Story Behind Charlotte’s Cap-Rate Numbers?
- Frequently Asked Questions
- Sources
What Do Charlotte Cap Rates Look Like Right Now?
Cap rates don’t move in a vacuum. They respond to vacancy, rent growth, and how aggressively money is chasing deals, and Charlotte’s numbers right now tell a fairly consistent story.
Metro-wide multifamily vacancy sits around low single digits, with moderate year-over-year rent growth, according to the same 2026 market report. That combination, rents still climbing while vacancy holds in a manageable range, is what’s keeping cap rates from expanding further even with borrowing costs elevated. NOI is growing enough to offset some of the pressure that higher rates would otherwise put on pricing.
Investor demand is doing its own work on pricing. Between January and May 2026, corporate and investor buyers acquired several thousand properties across the Charlotte metro, and a substantial majority of those deals closed in cash, per the Charlotte investor market report. Corporate entities now hold a significant share of that tracked stock. Cash buyers don’t need a lender’s cap-rate comfort zone to close, and that changes what “market pricing” even means in mid-priced tiers.
The construction pipeline is the wild card. New supply concentrated in South End, University City, and parts of the northeast corridor has kept effective rents flatter than headline asking rents in those specific pockets, even while metro rent growth stays positive. If you’re underwriting a deal in a submarket with heavy lease up activity nearby, don’t assume the metro-wide 3.2% applies to your building’s actual renewal rents.
- Vacancy and rent growth are both moving in a direction that supports NOI stability, not just headline pricing.
- Cash and corporate buyers are compressing cap rates specifically in the tiers they compete in hardest, typically $1 million to $5 million assets.
- New supply is submarket-specific enough that a metro average can hide a leasing problem two blocks away.
What Are Cap-Rate Ranges by Asset Class and Neighborhood?
Asset quality and location do more to move a Charlotte cap rate than almost anything else in this market, and the spread is wider than most first-time investors expect.
By quality tier, expect roughly this pricing:
- Class A, stabilized: 5.0% to 5.5%
- Class B, value-add potential: 5.5% to 6.5%
- Class C, deferred maintenance or older vintage: 6.5% to 8.5%
- Small 2 to 4 unit properties: often lower cap rates than comparable commercial multifamily, sometimes in the 4% to 6% range
That last point catches new investors off guard. Financing structure, not just location or condition, pushes those small properties to trade at tighter cap rates because 2 to 4 unit deals often qualify for residential-style financing with longer amortization and lower rates than a 5+ unit commercial loan. Cheaper debt supports a higher purchase price for the same NOI, which mathematically compresses the cap rate even when nothing about the property itself changed.
By neighborhood, the TrueCap Charlotte market analysis shows a wide band:
| Submarket | Typical Cap Rate Range |
|---|---|
| Uptown / South End | 3% to 5% |
| NoDa / Plaza Midwood | 4% to 6% |
| University City | 5% to 7% |
| East Charlotte | 6% to 8.5% |
| West Charlotte | 6% to 8.5% |
| Steele Creek and outer suburbs | 5% to 8% |
Pro Tip: Never anchor your offer price to a metro-average cap rate you found in a report. Pull the neighborhood band first, then adjust for asset condition and financing structure before you touch a purchase-price model.
What’s Driving Cap Rates Higher or Lower in Charlotte?
Three forces are pulling in different directions right now, and understanding which one dominates your deal matters more than watching any single headline number.

Borrowing costs remain the biggest swing factor. When debt gets more expensive, buyers typically need higher cap rates to hit their return targets, which pushes cap rates up (values down) unless something else offsets it. In Charlotte’s case, something else is offsetting it: sustained rent growth and heavy cash-buyer activity are absorbing pressure that would otherwise expand cap rates further.

Employment concentration in banking and fintech continues to support in-migration and rent growth, which stabilizes the NOI side of the equation even when rates stay elevated. That’s part of why core neighborhoods keep compressing rather than drifting wider.
Then there’s the demand-side story: 61.3% of tracked Charlotte investor purchases closed in cash in the first five months of 2026, per the Charlotte investor market report. Cash buyers competing for the same mid-priced assets as leveraged investors will pay tighter cap rates because they’re not constrained by a lender’s debt-service coverage requirements. If you’re financing your acquisition, you’re bidding against buyers who don’t share your cost of capital.
- Rising rates typically push cap rates wider, but strong NOI growth is currently offsetting much of that pressure.
- Employment and migration trends are propping up rent growth, which supports pricing even at elevated rates.
- Cash and corporate buyers are compressing cap rates specifically in tiers where they’re most active.
How Do You Calculate and Use a Cap Rate?
The formula is simple, but getting the inputs right is where most first-time buyers stumble.
Cap Rate (%) = (Annual NOI ÷ Property Value) × 100
NOI, defined by Investopedia, is total rental and ancillary income minus operating expenses. It excludes mortgage debt service entirely, which is exactly why cap rate reflects a property’s unlevered return rather than your actual cash-on-cash yield after financing.
A quick example: a 24-unit workforce housing property in East Charlotte generates $420,000 in annual stabilized NOI. Listed at $6 million, that’s a 7% cap rate ($420,000 ÷ $6,000,000 = 0.07). Compare that to a South End Class A building generating the same $420,000 NOI but priced at $8.4 million, a 5% cap rate, and you can see how location alone shifts pricing on identical income.
Before you trust that number, run these checks:
- Confirm whether the NOI is trailing twelve months or a stabilized projection. They’re rarely the same number.
- Verify lease terms and rent roll accuracy using a proper lease abstract rather than trusting a broker’s summary sheet.
- Check Mecklenburg County’s reassessment cycle. A property tax spike after reassessment can quietly erode NOI you underwrote a year earlier.
- Switch to DCF or IRR modeling when NOI is irregular or the hold period involves major capital improvements, since cap rate alone can mislead in those cases.
- Cap rate is a snapshot, not a forecast; it says nothing about your financing costs or exit timing.
- The typical investor range across property types runs from about 5% to 10%, and Charlotte multifamily sits solidly in the tighter half of that band right now.
Where Are Charlotte Cap Rates Headed Next?
Expect gradual, submarket-specific movement over the next 12 months rather than a broad shift in either direction. Core neighborhoods with strong in-migration and constrained land, think South End and parts of NoDa, will likely keep compressing as capital keeps chasing limited inventory. Outer submarkets facing new supply deliveries may see cap rates hold flat or widen slightly as leasing agents work through concessions.
- Uptown and South End: expect continued compression as cash buyers dominate that price tier.
- East and West Charlotte: yield-driven opportunities remain if you can underwrite realistic operating costs.
- University City and Steele Creek: watch construction pipeline closely before locking rent growth assumptions.
Pro Tip: Build your reassessment calendar into your five-year hold model now. Mecklenburg County property tax increases after reassessment have caught more than a few out-of-state buyers off guard on year-two NOI.
Where Does This Cap-Rate Data Come From?
The figures throughout this report draw from the 2026 Charlotte commercial real estate market report, the TrueCap Charlotte neighborhood analysis, and the Charlotte investor market report covering January through May 2026 transaction activity.
Providers differ in methodology. Some report asking cap rates from listings, while others calculate closed-transaction cap rates, and small 2 to 4 unit sales get bundled with residential comps in some datasets while institutional 5+ unit deals get tracked separately in others. Before you rely on any range for a live deal, check recent closed comps, pull current Mecklenburg County tax records, and confirm your lender’s underwriting assumptions match current rate environments.
- Cross-check headline cap-rate ranges against recent closed comps in your specific submarket, not metro averages.
- Confirm whether a reported rate reflects asking price or closed transaction price.
- Verify current Mecklenburg County assessed value and effective tax rate before finalizing NOI projections.
Where Should Charlotte Investors Get Underwriting Help?
Cap rates tell you what the market is willing to pay for a dollar of income, they don’t tell you whether your financing, your lease assumptions, or your tax projections will hold up two years into the hold. That’s where a lot of out-of-town buyers get burned in Charlotte specifically, because the metro’s cash-buyer competition makes properties look more expensive on a cap-rate basis than a straightforward debt-service coverage calculation would suggest is safe.
Ardorcre works directly with Charlotte MSA investors on sales, leasing, and landlord and tenant representation across office, medical, retail, and industrial assets, and that on-the-ground submarket knowledge is exactly what turns a cap-rate range into a real underwriting decision. If you’re sizing debt against a Charlotte acquisition, our DSCR loan sizing guide walks through how lenders actually stress-test these deals before you make an offer.
What’s the Real Story Behind Charlotte’s Cap-Rate Numbers?
Most cap-rate coverage treats Charlotte like a single data point, and that’s the biggest mistake I see investors make with this market. Treating those as the same market gets people overpaying in one submarket while walking past real yield in another.
The conventional advice, watch interest rates and wait for cap-rate expansion, misses what’s actually happening on the ground here. Cash buyers and corporate entities aren’t waiting for anything.
If I had to prioritize one thing for readers underwriting a Charlotte deal right now, it’s this: stop anchoring to the metro number and start building submarket-specific comps before you make an offer. The neighborhood-level knowledge, not the headline rate, is where the real edge sits in this market.
Frequently Asked Questions
What is a good cap rate for Charlotte investment property right now?
Why are cap rates lower in Uptown and South End than the rest of Charlotte?
Does a higher cap rate always mean a better deal?
No. A higher cap rate often signals higher perceived risk, deferred maintenance, weaker location fundamentals, or less stable tenancy. It reflects pricing relative to income, not deal quality on its own.
How do rising interest rates affect Charlotte cap rates?
Higher borrowing costs typically push cap rates wider over time, but sustained rent growth and heavy cash-buyer activity in Charlotte have offset much of that pressure so far in 2026.
Should I use cap rate or IRR to evaluate a Charlotte property?
Use cap rate for a quick comparative snapshot across similar properties. Switch to DCF or IRR modeling when NOI is irregular, you’re planning major capital improvements, or your hold period extends beyond a simple stabilized year.
This article is general information, not a substitute for advice from a qualified financial advisor. Consult a qualified financial professional about your own circumstances before acting on anything here.
Sources
For live-deal verification, pull cap-rate ranges from the CLS CRE Charlotte market report for metro fundamentals, TrueCap’s neighborhood analysis for submarket bands, and the Charlotte investor market report for buyer behavior trends.
- Charlotte Commercial Real Estate Market 2026 | Cap Rates
- Charlotte Rental Market Analysis 2026 — Cap Rates | TrueCap
- Charlotte Investor Market Report: Q1–Q2 2026 Data