
Retail site selection is the data-driven process of finding the store location that maximizes profitable customer reach. Start this week by pulling foot-traffic reports for your top three candidate markets, running a trade-area scan using mobility data, and mapping direct competitors within a 10-minute drive of each site.
Three immediate actions worth doing now:
- Run a trade-area scan. Use mobility data to see where customers actually come from, not just who lives within a fixed radius.
- Request foot-traffic reports. Dwell time, visit frequency, and cross-shopping patterns tell you far more than raw traffic counts.
- Map competitor density. Identify saturation and whitespace before you spend a dollar on site visits.
The shift from gut-feel leasing to evidence-based site decisions is no longer optional for retailers who want predictable unit economics. Mobility data, consumer spending layers, and GIS-based scoring now give any retailer access to the same analytical rigor that big-box chains have used for decades.
Table of Contents
- What is retail site selection, and when do you need a formal process?
- Why data-driven site decisions outperform intuition
- What does the retail site selection process look like, step by step?
- Which data layers and tools actually move the needle in U.S. site analysis?
- How do you score and rank candidate sites objectively?
- How do you model the financials and negotiate a lease you can live with?
- What KPIs should you track after opening, and when?
- A Charlotte MSA case example: how the process plays out locally
- Key Takeaways
- What most retailers get wrong about site selection
- Ardorcre’s retail site advisory in the Charlotte MSA
- Authoritative datasets and public sources to consult
What is retail site selection, and when do you need a formal process?
Retail site selection is the structured evaluation of candidate locations against a defined set of business, market, and financial criteria. It differs from opportunistic leasing, where a retailer signs a lease because a space became available, in that it starts with strategy and ends with a defensible, scored decision.
You need a formal process when the stakes are high enough that a wrong call is hard to reverse:
- You are entering a new market or metro area for the first time.
- The projected build-out or tenant improvement investment exceeds $150,000.
- The lease term is five years or longer.
- You are opening multiple locations and need a repeatable framework.
- You are optimizing an existing portfolio and need to identify underperforming or cannibalized stores.
A lighter evaluation, essentially a checklist review, works for short-term pop-ups, month-to-month licenses, or renewals where the trade area is already well understood. For anything with a long-term financial commitment, the full process pays for itself quickly.
Why data-driven site decisions outperform intuition
Location is the single largest fixed-cost decision most retailers make. It shapes revenue potential, customer acquisition cost, and logistics in ways that are nearly impossible to unwind mid-lease.
The industry has moved decisively away from subjective site decisions toward rigorous, multi-layered analysis combining demographic, traffic, and financial metrics. The reason is straightforward: a location that looks great from the street can sit in a trade area with the wrong income profile, too much competitive supply, or a customer base that already shops a competitor two miles away.
Brick-and-mortar stores still account for 85% of U.S. retail sales in 2024. Location decisions carry more weight, not less, even as e-commerce grows.
The metrics that matter most are sales per square foot, conversion rate, and customer acquisition cost by location. Retailers who track these against pre-opening forecasts can identify which site assumptions failed and correct them before the next opening. Those who skip the analysis have no baseline to compare against, and no way to know whether a slow store is a site problem, an operations problem, or a market problem.
Understanding retail market shifts in your target metro also matters. Anchor tenant closures, demographic migration, and new mixed-use development all change the trade-area math in ways that raw traffic counts miss.

What does the retail site selection process look like, step by step?
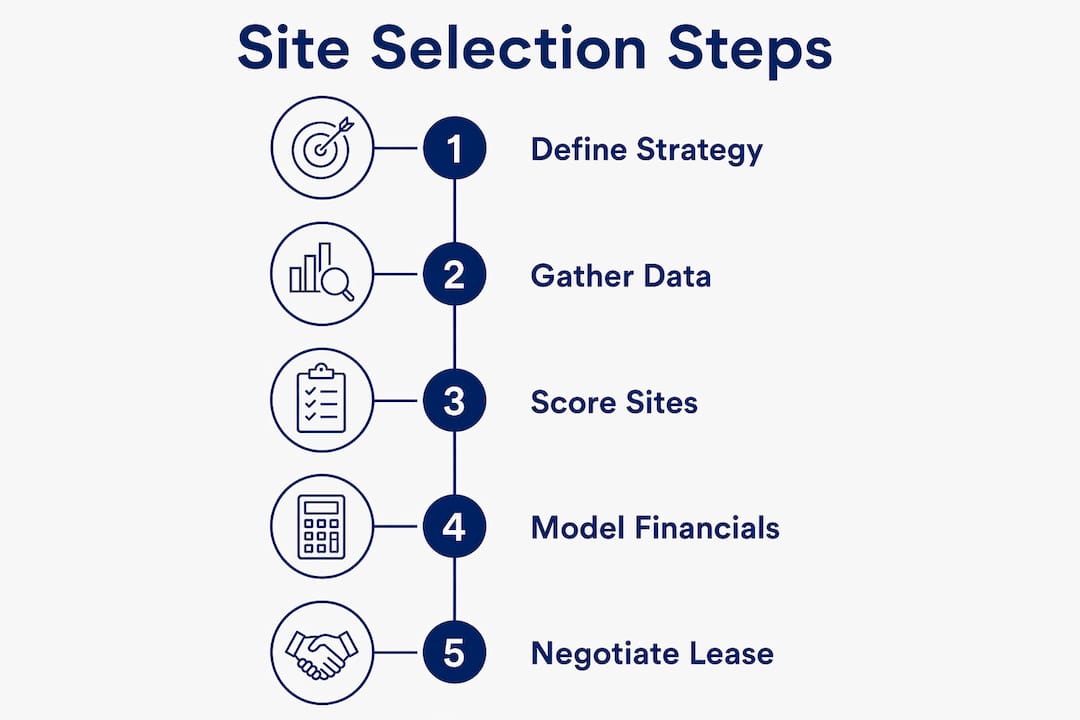
A seven-to-eight-step framework covers the full cycle from strategy through post-opening validation. Here is how each stage works in practice.
- Define strategy and target customer profile (1–2 weeks). Outputs: target personas, acceptable trade-area definitions, non-negotiable site criteria. Owner: leadership and marketing.
- Market screening and prioritization (2–3 weeks). Filter metros or submarkets by population size, income, competitive density, and brand fit. Output: ranked market shortlist.
- Trade-area mapping and catchment analysis (2–3 weeks). Use mobility data to identify true customer origins rather than fixed-radius buffers. Output: trade-area polygons, overlap measures.
- Site identification and field audit (2–4 weeks). Walk candidate sites, photograph access points, assess co-tenancy, and collect landlord terms. Output: short list with site photos and preliminary lease terms.
- Demand modeling and revenue forecasting (2–3 weeks). Build analog or regression models to forecast sales. Output: base, optimistic, and downside scenarios with explicit assumption tables.
- Scoring, ranking, and negotiation readiness (1–2 weeks). Apply weighted scores across all criteria. Output: ranked site list and deal targets for negotiation.
- Lease negotiation and decision (4–8 weeks). Negotiate TI allowances, rent abatement, and escalation clauses. Output: signed LOI or lease.
- Post-opening validation loop (ongoing from Day 1). Track KPIs against forecast assumptions. Output: 30/90/180-day performance report and course-correction plan.
| Stage | Key Deliverable | Typical Duration |
|---|---|---|
| 1. Strategy definition | Target personas, site criteria | 1–2 weeks |
| 2. Market screening | Ranked market shortlist | 2–3 weeks |
| 3. Trade-area mapping | Trade-area polygons, overlap data | 2–3 weeks |
| 4. Site identification | Short list, field audit notes | 2–4 weeks |
| 5. Demand modeling | Sales forecast, scenario runs | 2–3 weeks |
| 6. Scoring and ranking | Weighted site scores | 1–2 weeks |
| 7. Lease negotiation | Signed LOI or lease | 4–8 weeks |
| 8. Post-opening validation | KPI baseline and validation plan | Ongoing |
Total elapsed time from strategy kick-off to signed lease typically runs several months for a single location. Multi-market expansions compress some stages through parallel workstreams.
Which data layers and tools actually move the needle in U.S. site analysis?
The core data layers for any U.S. retail location analysis are mobility and foot traffic, consumer spending, demographics and psychographics, competitive density, property and lease data, and planned development and zoning. Each answers a different question.
- Mobility and foot-traffic data. Beyond raw visit counts, modern providers surface dwell time, visit frequency, cross-shopping, and hourly patterns that inform store format and staffing decisions.
- Consumer spending data. Tells you whether the trade area has the wallet to support your price point, not just the population.
- Demographics and psychographics. Population density, income, age, and household characteristics from the U.S. Census Bureau form the baseline; psychographic segmentation adds behavioral depth.
- Competitive density. Store locations, proximity, and saturation levels show whether a site fills a gap or enters an already crowded market.
- Property and lease data. Rent per square foot, available inventory, and historical lease terms from commercial listing platforms.
- Planned development and zoning. Approved projects, rezoning applications, and infrastructure plans that will change the trade area over your lease term.
On the tools side, GIS and spatial analytics platforms such as ArcGIS let analysts score and visualize site suitability using hundreds of demographic variables simultaneously. Foot-traffic analytics platforms provide the visit and mobility layer. Analog and regression models handle demand forecasting. CRM integration connects historical sales data to new-site projections.
Pro Tip: When evaluating a foot-traffic vendor, ask for the methodology behind their panel: sample size, device coverage, and how they handle privacy compliance under state-level regulations. A vendor who cannot answer those questions clearly is one whose data you cannot defend in a board presentation.

How do you score and rank candidate sites objectively?
The goal of scoring is a defensible, ranked comparison, not a perfect score. Weight criteria to match your brand’s priorities rather than using generic averages, because what drives a quick-service restaurant differs sharply from what drives a destination furniture retailer.
Core scoring dimensions and example weights by retailer archetype:
| Dimension | Convenience Retail | Destination Retail | Service-Based Retail |
|---|---|---|---|
| Demand fit (demographics, spending) | — | 20% | — |
| Accessibility and visibility | — | 15% | 20% |
| Competitive context | 15% | 20% | 15% |
| Lease cost vs. sales potential | 20% | 20% | 20% |
| Co-tenancy and anchor quality | 10% | 15% | 10% |
| Future growth potential | 5% | 10% | 10% |
To build a working scorecard, set up a spreadsheet with these columns: Site ID, raw metric value for each dimension, normalized score (1–10), weight, and weighted score. Sum the weighted scores for a total. Run a sensitivity test by shifting each weight ±15% to see whether your top-ranked site holds its position. If the ranking flips with a small weight change, the decision is closer than it looks and warrants deeper diligence on the swing factor.
How do you model the financials and negotiate a lease you can live with?
Revenue forecasting starts with one ratio: rent as a percentage of projected sales. Most retail categories target rent at 5–10% of gross sales; specialty and food-and-beverage formats often run higher. If your rent-to-sales ratio exceeds your category benchmark at the forecast sales level, the site economics are marginal before you account for build-out costs.
Build your financial model around these inputs:
- Projected sales per square foot (from analog or regression model)
- Total occupancy cost (base rent + NNN charges + estimated CAM)
- Tenant improvement allowance and any rent abatement period
- Build-out and FF&E costs net of TI
- Operating expenses: labor, inventory, utilities, insurance
- Payback period on net build-out investment
Common lease levers worth negotiating:
- Tenant improvement allowance (TI). Push for a per-square-foot TI that covers at least 50–60% of your build-out cost on a standard vanilla-box space.
- Rent abatement. Two to four months of free rent during build-out is standard in most U.S. markets; more is achievable in high-vacancy submarkets.
- Rent escalation structure. Fixed annual increases (2–3%) are more predictable than CPI-indexed escalations, which can spike in inflationary periods.
- Base year taxes and CAM caps. Cap annual CAM increases at 3–5% and negotiate a base year for property tax pass-throughs.
- Co-tenancy clause. If an anchor tenant drives your traffic, a co-tenancy clause lets you reduce rent or exit if that anchor leaves.
- Exclusivity. Restrict the landlord from leasing to direct competitors within the same center.
Budget 4–8 weeks for lease negotiation after you select a site. Factor in legal review, which typically runs $2,000–$5,000 for a standard retail lease, and permit timelines, which vary widely by municipality.
What KPIs should you track after opening, and when?
Post-opening validation closes the loop between your pre-opening forecast and actual performance. The primary KPIs are sales per square foot, transactions per visit, conversion rate, average ticket, customer acquisition cost, and trade-area overlap with existing locations.
- 30-day checkpoint. Establish your baseline: actual daily traffic versus forecast, conversion rate, and average ticket. Identify any operational issues (staffing gaps, inventory mismatches) that are distorting early performance. Do not draw site conclusions yet.
- 90-day checkpoint. Compare cumulative sales to the base-case forecast. If sales are running below 75% of forecast, trigger a promotional plan or operational review before attributing the gap to the site itself. Check whether the customer origin data matches your pre-opening trade-area assumptions.
- 180-day checkpoint. Full performance review against all forecast assumptions. Map which specific assumptions (customer conversion rate, visit frequency, average ticket) failed and by how much. This is the data that improves your next site forecast.
On cannibalization: keep trade-area overlap below roughly 20% between existing and new locations to avoid materially pulling revenue from stores you already own. If post-opening data shows overlap climbing above that threshold, use actual visit data to calculate the share of new-store customers coming from your existing trade areas before deciding whether to adjust marketing or reconsider the network plan.
A Charlotte MSA case example: how the process plays out locally
The Charlotte metro illustrates why a generic national framework needs local calibration. Charlotte’s rapid population growth, active mixed-use development pipeline, and shifting retail corridors mean that a trade-area analysis run 18 months ago may already be stale.
Consider a specialty food retailer evaluating three sites in the Charlotte MSA: one in South End, one in Ballantyne, and one in Concord Mills corridor. A market screening pass using income, population density, and competitive density quickly eliminates the Concord Mills site due to high fast-casual saturation. Trade-area mapping with mobility data then reveals that the South End site draws heavily from a younger, higher-income renter demographic with strong spending on food and beverage, while Ballantyne skews toward established households with higher average tickets but lower visit frequency. The scoring model, weighted toward visit frequency and conversion for this format, ranks South End first despite its higher rent per square foot, because the rent-to-sales ratio holds within the target band at the forecast sales volume.
The local development pipeline matters here. South End has approved mixed-use projects adding residential density within the trade area over the next 24 months, which the demand model captures as an upside scenario.
Charlotte-area site evaluation checklist:
- Confirm zoning classification and permitted use before any financial modeling.
- Check the City of Charlotte and Mecklenburg County planning portals for approved projects within a one-mile radius.
- Request NCDOT traffic count data for the specific access points, not just the corridor average.
- Verify co-tenancy clause enforceability under North Carolina commercial lease law with local counsel.
- Map proximity to planned light rail extensions, which materially shift pedestrian trade areas in Charlotte’s urban core.
Key Takeaways
A rigorous, data-driven retail site selection process, built on mobility data, GIS scoring, and financial modeling, is the most reliable way to reduce location risk and build a defensible expansion strategy.
| Point | Details |
|---|---|
| Start with data, not instinct | Mobility, spending, and demographic layers replace fixed-radius guesses with actual customer origin data. |
| Use a staged 7–8 step process | Each stage has defined deliverables; skipping stages compresses timelines but inflates risk. |
| Weight your scorecard to your brand | Convenience retailers prioritize accessibility; destination formats weight demand fit and co-tenancy more heavily. |
| Keep trade-area overlap below 20% | Cannibalization becomes material above that threshold; use actual visit data to measure it, not radius buffers. |
| Ardorcre for Charlotte MSA decisions | Ardorcre provides local site scouting, tenant representation, and lease negotiation across the Charlotte metro. |
What most retailers get wrong about site selection
The conventional wisdom says visibility is king. Drive counts, pylon signage, and corner locations dominate the conversation in most site tours. Those factors matter, but they are consistently overweighted relative to the variables that actually drive unit economics.
The most common error is treating foot traffic as a proxy for your foot traffic. A high-traffic corridor full of commuters passing through at 65 mph is not the same as a moderate-traffic center where your target customer shops three times a week. Dwell time and cross-shopping data separate those two scenarios; raw counts do not.
The second error is underestimating local development. In fast-growing metros like Charlotte, a site that looks marginal today can flip to strong within 24 months if the right residential or mixed-use project delivers nearby. The inverse is also true: a site anchored by a struggling national tenant can deteriorate faster than a five-year lease allows you to exit.
Three quick wins that consistently improve outcomes:
- Pull the actual permit history for the building and the center before signing. Deferred maintenance and code issues become your problem once you are in occupancy.
- Talk to existing tenants in the center, not just the leasing broker. They will tell you about parking conflicts, landlord responsiveness, and seasonal traffic patterns that no dataset captures.
- Model the downside scenario first. If the site does not work at 70% of your base-case sales forecast, the lease terms need to reflect that risk, or the site needs to come off the list.
Ardorcre’s retail site advisory in the Charlotte MSA
Retailers who have done the analysis know what they are looking for. The harder part is finding the right space, negotiating terms that reflect the actual risk, and moving fast enough in a competitive leasing market. That is where a local advisor earns their keep.
Ardorcre works with retail tenants and landlords across the Charlotte MSA, covering site scouting, tenant and landlord representation, lease negotiation, and due diligence on available retail properties. The firm’s advisors bring direct knowledge of Charlotte’s submarket dynamics, development pipeline, and landlord relationships, which shortens the time between site identification and signed lease.
If your build-out investment exceeds $100,000 or your lease term runs five years or longer, the cost of a local advisor is a fraction of what a poorly negotiated lease or a wrong-market decision costs over the lease term. Learn more about Ardorcre’s advisory team and reach out to discuss your site criteria and target submarkets in the Charlotte area.
Authoritative datasets and public sources to consult
Good site analysis depends on good data. Here is where to start and what each source contributes.
- U.S. Census Bureau (census.gov). Population, income, household characteristics, and retail sales benchmarks. Free, authoritative, and updated regularly. Use it as the demographic baseline for any trade-area analysis.
- NAIOP Research Foundation (naiop.org). Commercial real estate research including retail leasing strategies and market analysis frameworks. Useful for benchmarking lease terms and understanding landlord perspectives.
- Mobility and foot-traffic vendors. Platforms that provide device-level visit data, dwell time, and cross-shopping analytics. When evaluating a vendor, ask for panel size, methodology documentation, and how they handle state privacy regulations. Freshness matters: data older than 90 days may not reflect current patterns in fast-changing trade areas.
- Local planning portals. City of Charlotte and Mecklenburg County planning departments publish approved development projects, rezoning applications, and infrastructure plans. These are free and often overlooked by out-of-market analysts.
- GIS platforms. Spatial analytics tools that layer demographic, competitive, and mobility data for visual scoring and comparison. ArcGIS is the most widely used in commercial real estate; browser-based alternatives have lowered the barrier for smaller teams.
- Commercial listing platforms. Active inventory, asking rents, and historical lease comps for the Charlotte MSA and national markets.
To validate any vendor or dataset before committing budget: ask for a sample report on a market you already know well, check the methodology for sample size and recency, and confirm privacy compliance documentation. A dataset that cannot be explained clearly is one that cannot be defended to a landlord, a board, or a lender.
For local proof points and current Charlotte submarket data, Ardorcre’s market analysis resources and advisory team are a practical starting point.
This article provides general informational guidance on retail site selection. It is not legal, financial, or real estate advice. Confirm current zoning, lease terms, and market conditions with a qualified commercial real estate advisor and legal counsel for your specific situation.